10 Minutes Weekly Picture: Third Straight Losing Week for S&P 500...
All major US indices ended lower with the S&P 500 dropped -2.75% last week. Market sentiment remained dominated by concerns of abrupt tightening in monetary policy due to lingering concerns of soaring inflation.
Tech titans such as $Apple(AAPL)$, $Microsoft(MSFT)$, $Amazon.com(AMZN)$ and $Alphabet(GOOGL)$ will be reporting earnings in the coming week. Meanwhile, preliminary data for Q1 GDP growth will be released along with what will be closely watched inflation readings.
Here’s what you need to know to start your week.
1. Big tech earnings
Almost 180 companies listed in the S&P 500, worth approximately half of the benchmark index’s market value, are due to report results this week, including the four largest U.S. companies by market capitalization: Apple ($AAPL), Microsoft ($MSFT), Amazon ($AMZN), and Google parent Alphabet ($GOOGL).
All four stocks have fallen so far this year, with Apple losing around 9%, Amazon down 13%, Alphabet dropping 17% and Microsoft off 18%.
First quarter earnings expectations are muted, and a selloff in Netflix ($NFLX) shares after the streaming giant reported falling subscriber numbers has exacerbated concerns about upcoming tech earnings.
Among some of the other big names reporting this week are Facebook ($FB) owner Meta Platforms, payment companies Visa ($V) and Mastercard ($MA), oil majors Chevron ($:CVX) and Exxon Mobil ($XOM), and consumer companies Coca-Cola ($KO) and Pepsico ($PEP).
Key Economic Calendar (Weekly)
U.S. is set to release preliminary data on first quarter growth on Thursday with GDP expected to slow sharply to 1.1% from 6.9% in the final quarter of 2021 amid the effects of the Omicron wave of the pandemic at the start of the year.
The GDP data will be followed a day later by the personal consumer expenditures index, believed to the Fed’s preferred gauge of inflation.
All times listed are EDT
Thursday
8:30: US – GDP: forecast to plummet to 1.1% from 6.9% QoQ.
Friday
8:30: US – Core PCE Price Index m/m: to lower to 0.3% from 0.4% MoM.
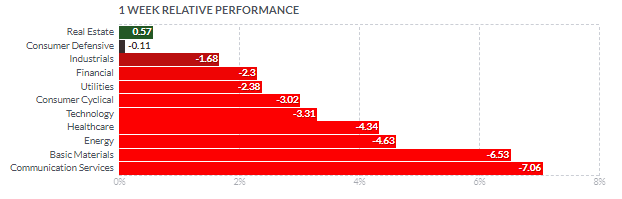
Top 3 Leading and Lagging Sectors (Weekly)
10 of the 11 S&P 500 sectors closed lower with the worst performers being the communication services (-7.0%), materials (-6.5%), and energy (-4.6%) sectors.
The defensive-oriented real estate (+0.5%) is the sole sector that ended last week in positive territory.
 Market Breath (Weekly)
% of Stocks Above 50 DMA = 33.87% (-22.83%)
% of Stocks Above 200 DMA = 33.07% (-8.14%)
Market Technicals– (S&P 500, NASDAQ, Bitcoin, Bonds & Credit Spread, NAAIM)
$SPX (S&P 500) vs $RSP (S&P 500 Equal Weight) – (Net High/Low -350)
Wall Street’s three main benchmarks ended in negative territory for the week, in what was the third straight week of losses for both the S&P 500 ($SPX) and the Nasdaq ($QQQ), while the Dow Jones Industrial Average ($DJI) posted its fourth weekly decline in a row.
The S&P 500 ($SPX) fell -2.75% last week after a promising start devolving into a disappointing trend-down session, $SPX sliced through its major moving averages and volume weighted moving average from all time high after losing its posture trying to hold its 200-day moving average, all in a single day session on Thursday.
The problem last week was mainly threefold:
- The 10-yr yield rapidly approached 3.00%, hitting 2.97% before ending the week eight basis points higher at 2.91%,
- Fed Chair Powell wasn’t ready to declare peak inflation and said the Fed could move to a tight policy after reaching a neutral rate, and
- Weakening technical factors.
The breakdown in price action has negated $SPX initial display of a Bullish High Tight Flag formation (HTF).
The immediate support to watch for this week is at 4,150 level, a previous low level established in late February – mid March period.
$QQQ (Nasdaq 100) vs $QQQE (Nasdaq 100 Equal Weight) – $317 Level Critical Support, Strength remains at 200-Day Moving Average
Tech and growth names have been hard hit since the start of 2022 by a rapid rise in Treasury yields on the back of expectations that the Fed will hike interest rates aggressively to combat high inflation as higher rates can hurt their companies with high valuations based on the prospect of future profits.
$QQQ fell -3.85%, remaining resisted to its declining 10, 20 and 50-day moving averages. The support level to watch for $QQQ this week is at $317. A breakdown of this level will see $QQQ trading at its lowest level year to date.
$BTCUSD (Bitcoin / USD) – Bearish Head and Shoulder Pattern Breakdown at $38,500
Bitcoin ($BTCUSD) fell -0.56% last week, resisted by Its declining short term 10 and 20-day moving averages.
The next level of support to watch for $BTCUSD is at $38,500, a level that would play out the breakdown of its 8 months bearish Head and Shoulder chart pattern.
$PCCE (Put/Call Ratio Equity) & $VIX (Volatility S&P 500) – $PCCE at Highest Level Since March 2020
The spike level to watch for $PCCE in the last 24 months period is at 1.00. The current reading of 1.183 (+57.00%) reflects risk-off sentiment of the market as it jumped to its highest level since March 2020. The critical level to watch for $PCCE is at 1.40 for further accelerated sell off in the equities market.
The CBOE Volatility index ($VIX), also known as Wall Street’s fear gauge, jumped to 28.20 (+24.23%) last week, ending at its highest level since mid-March.
$IEI/$HYG (Credit Spread) – $TNX (10YR Treasury Yield) – Yield at 3 Years High
Market participants are keeping a close watch on credit spreads as one of the better economic signals. Junk bond issuers are perceived to be bigger credit risks, so if economic growth slows or contracts, there will be increased angst that these issuers won’t be able to make good on their interest payments. Hence, a widening high-yield spread is regarded as a leading indicator of difficult economic times which, in turn, often invites a more challenging period for the stock market since difficult economic times translate into weaker earnings prospects.
Credit Spread remains muted with a minimal increase to 1.51% over the week (+0.01), though $TNX pushed further up to 2.905% (+0.076).The 2-yr yield, which is sensitive to expectations for the fed funds rate, climbed 27 basis points to 2.72%.
NAAIM Exposure Index 74.05 (+10.76)
The NAAIM Exposure Index represents the average exposure to US Equity markets reported by members of the National Association of Active Investment Managers. It provides insight into the actual adjustments active risk managers have made to client accounts over the past two weeks. The blue line depicts a two-week moving average of the NAAIM managers’ responses.
This week’s NAAIM Exposure Index number is: 74.05 bouncing off from last April’s low of 63.29.
Top Trading Ideas for the Week : $Silicon Motion Technology(SIMO)$ $On Holding AG(ONON)$
Do follow me on twitter for more daily trading ideas @jeffsuntrading
https://twitter.com/jeffsuntrading/
Disclaimer: Investing carries risk. This is not financial advice. The above content should not be regarded as an offer, recommendation, or solicitation on acquiring or disposing of any financial products, any associated discussions, comments, or posts by author or other users should not be considered as such either. It is solely for general information purpose only, which does not consider your own investment objectives, financial situations or needs. TTM assumes no responsibility or warranty for the accuracy and completeness of the information, investors should do their own research and may seek professional advice before investing.
more
Sharing