Today, let’s talk about one of the hottest topics in the investment world recently: the sharp rally in the U.S. semiconductor sector. It is fair to say that, whether we look at the fundamentals and financial data or at market price performance, the semiconductor sector has become a major driver of the recent rise in U.S. equities, and arguably the dominant one.
As we all know, in the recent performance of U.S. equity gains, large technology companies—especially the SOX Philadelphia Semiconductor Index—have delivered the largest share of the market’s beta gains. At the same time, in the upward revisions to average earnings-per-share expectations for the S&P 500, semiconductor names such as Nvidia and Micron have also made the biggest contributions.
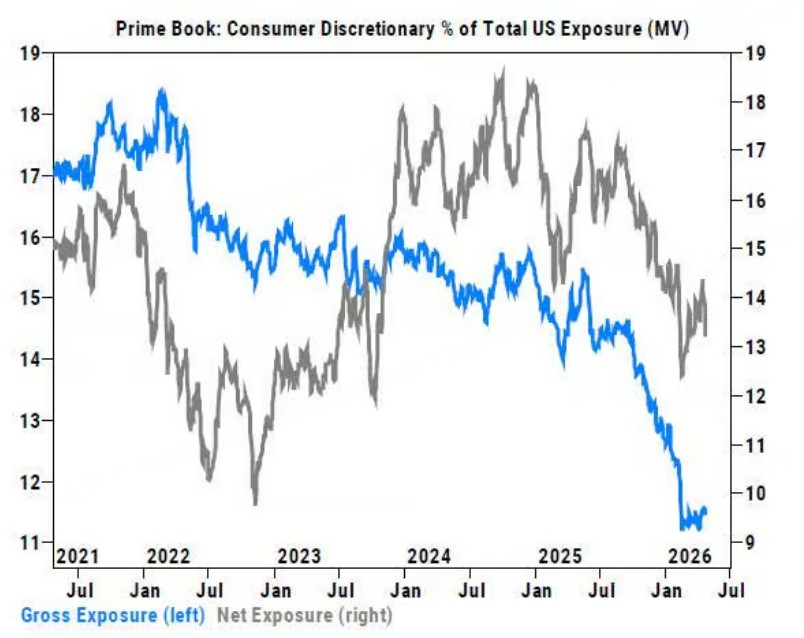
However, even in last week’s market rally, we could still see some underlying concerns. For example, as the crisis around the blockage of the Strait of Hormuz has continued, forward oil risk premiums have moved higher. The market has not failed to price in concerns about a surge in inflation; rather, those concerns have already been genuinely reflected in most parts of the consumer sector.
According to Goldman Sachs’ latest data, funds reduced their holdings in consumer discretionary stocks for the seventh consecutive week last week. The most significant net selling was concentrated in general retail, hotels, restaurants and leisure, textiles, apparel, and luxury goods:
How Narrow This Rally Really Is
There is an even more important point here: if we exclude the gains in the semiconductor sector and look only at the equal-weighted S&P 500, then in reality the U.S. stock market has barely risen at all this year:
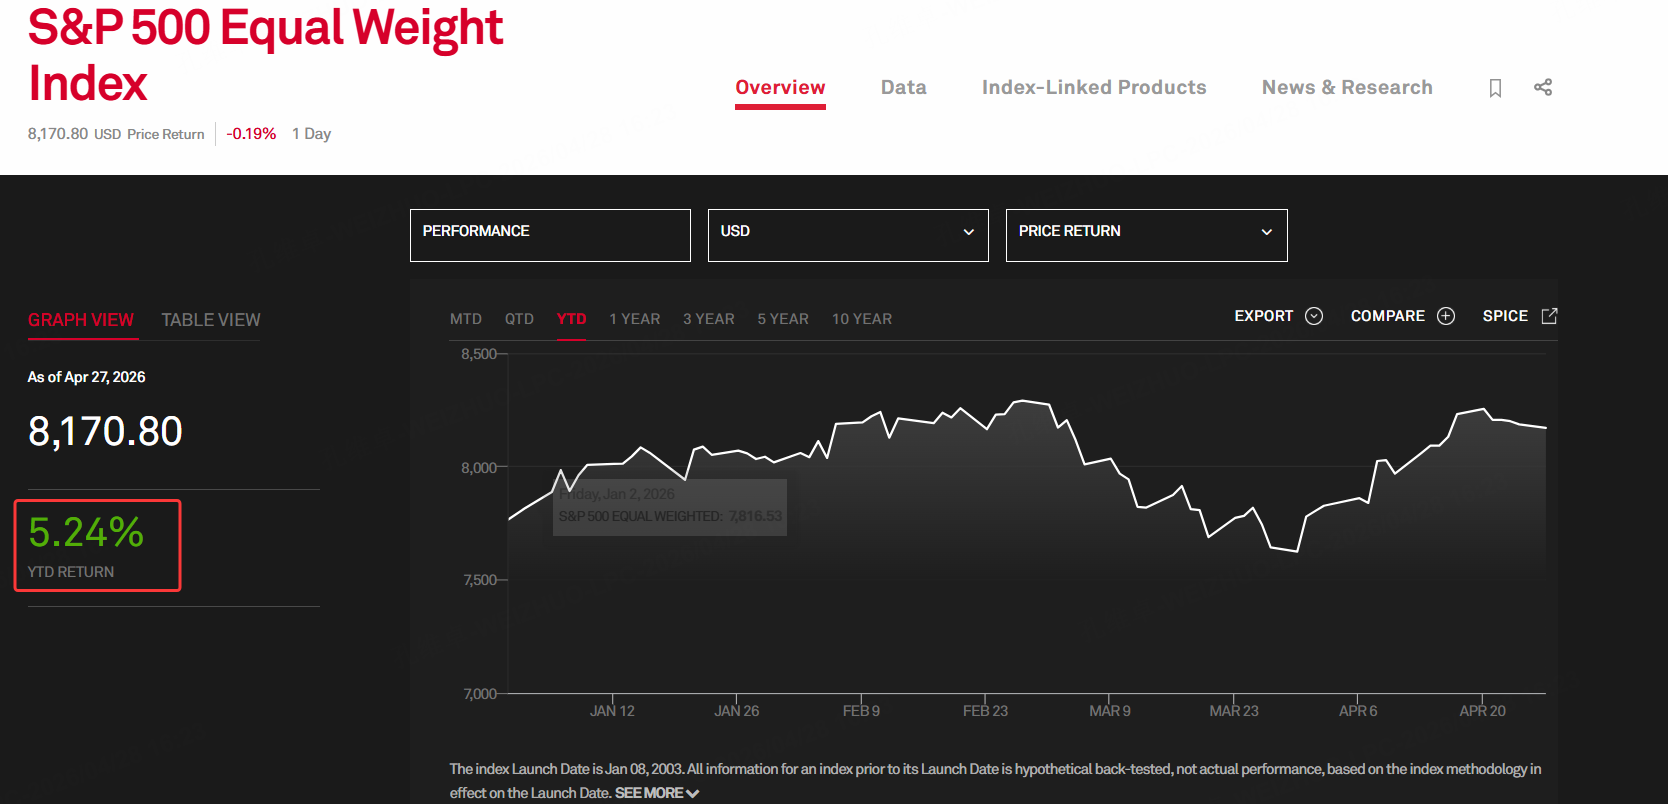
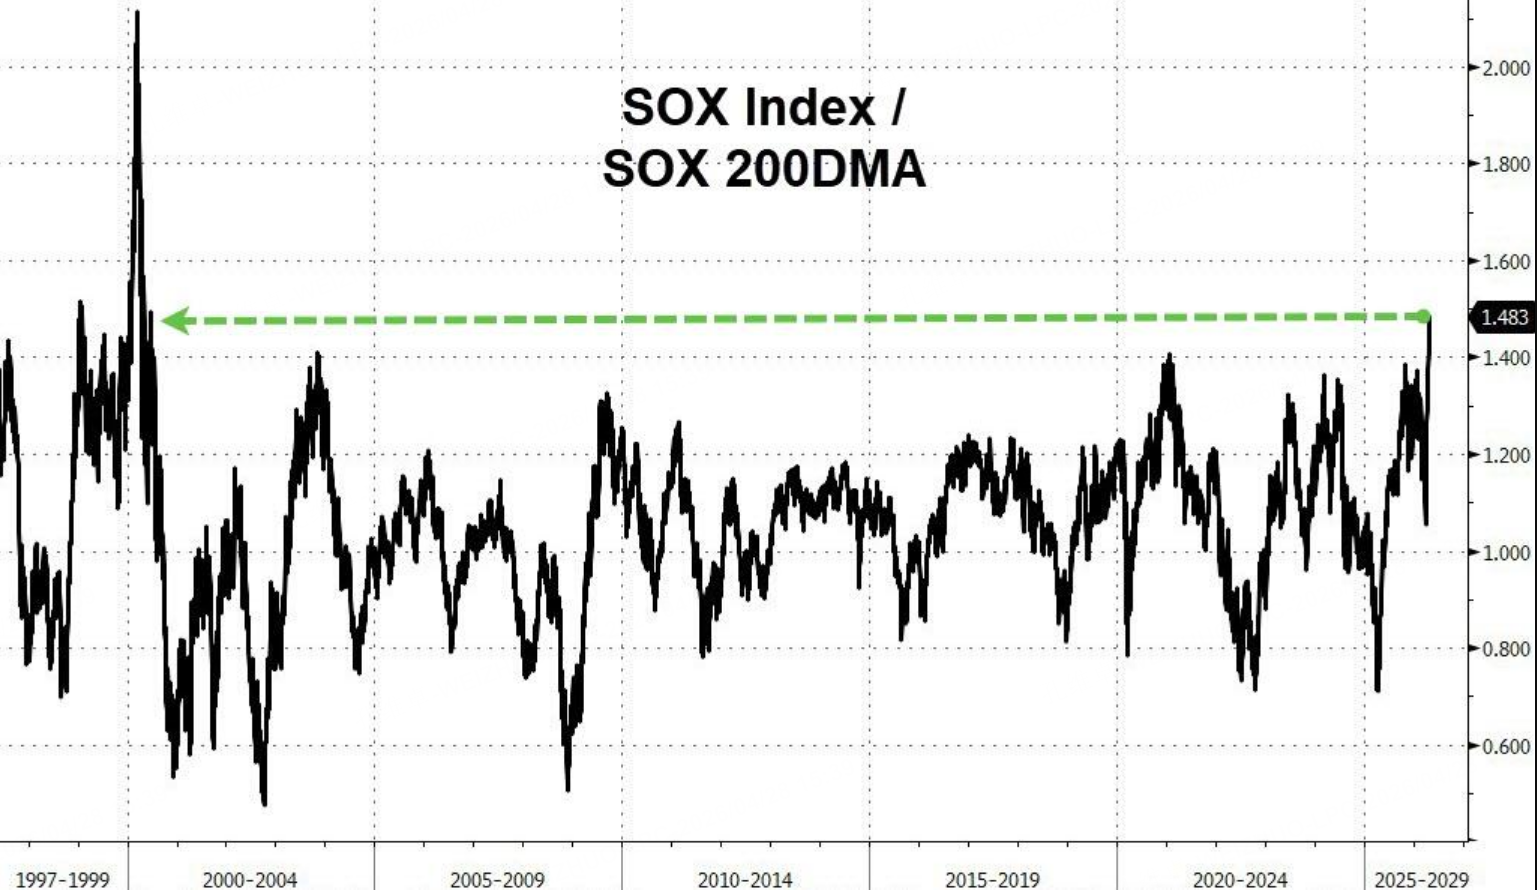
The so-called equal-weight S&P 500 means calculating the year-to-date performance of the index after assigning the same weight to all of its components. By that measure, the S&P 500 is up by less than 6 percentage points this year. As for the semiconductor sector, the Philadelphia Semiconductor Index, or SOX, has risen by nearly 23 percentage points year to date, and its distance above the 200-day moving average has reached the largest deviation seen in the past 30 years.
So in a U.S. market with such extreme concentration, should we still remain bullish on semiconductor stocks—and even on the broader indices—in the short term and continue chasing them higher?
Why Chasing Here Looks Risky
I believe the safest approach is definitely not to keep chasing at elevated levels, but rather to wait for a modest pullback and then turn bullish again from lower levels.
On the one hand, the market looks increasingly due for a correction. On the other hand, if we look at the overall direction of the semiconductor sector from both a fundamental and a sentiment perspective, we will find that the previous rally cannot really be described as especially solid or firmly supported by strong logic. In my view, the speculative element in this semiconductor rally is clearly greater than the underlying reality.
Why do I say that? Let’s look at the logic from two angles.
First: Valuations Are Outrunning Fundamentals
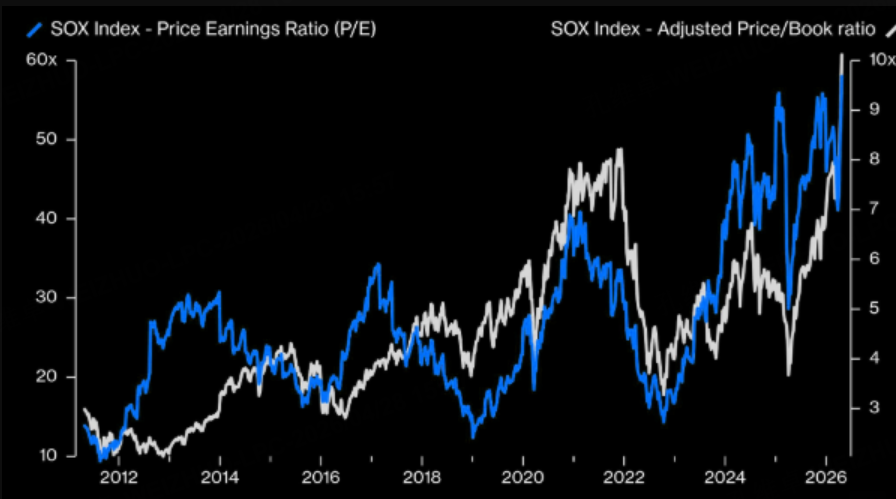
From this chart, we can see that the price-to-earnings ratio of the Philadelphia Semiconductor Index has reached a new high for nearly the past twelve years, with the multiple climbing to around 60 times earnings. But this high valuation comes together with the market’s expectation that future earnings growth will continue to accelerate. What we need to consider now is whether that earnings growth expectation can actually be realized. If that earnings story fails to materialize, could expensive chip stocks face a sharp de-rating?
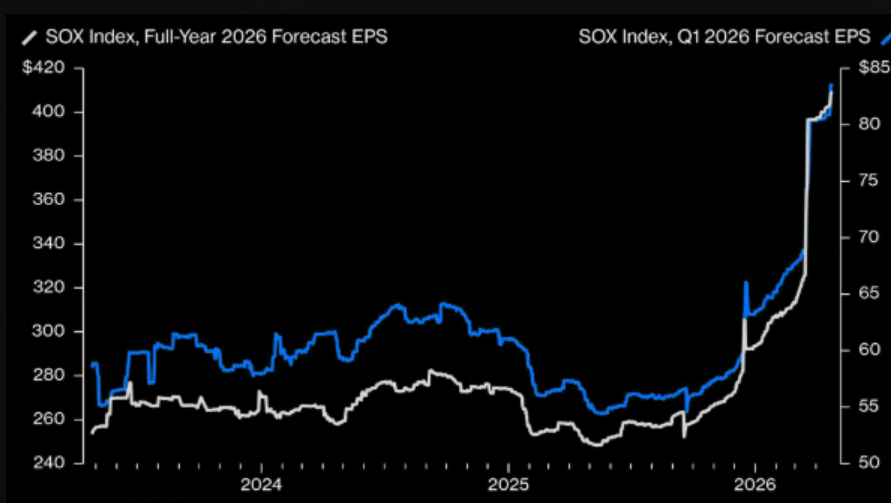
Now let’s look at this chart. It shows the expected earnings-per-share trend for the SOX Philadelphia Semiconductor Index. The blue line represents expected Q1 EPS, while the white line represents expected full-year EPS. The two lines are almost identical. Both began to surge at the start of 2026, forming an almost vertical rise. Clearly, it is this expectation that has pushed up the overall share prices of the semiconductor sector.
Two Reasons Behind the Valuation Surge
In my view, two forces are driving this sudden re-rating. First, expectations for capital expenditure by large technology companies have jumped sharply. The market expects demand for computing power to continue exploding, and people generally believe that future data center construction will absorb a huge amount of capital from across the economy and continue pushing up the share prices of related companies.
Second, rising tensions involving the United States, Iran, and the Strait of Hormuz have added to supply concerns, causing shortages of raw materials used in semiconductor equipment production, which in turn has raised the risk premium on finished products such as chip components. Let’s go through these two reasons one by one.
The AI Capex Story Sounds Right, but It Has Weak Spots
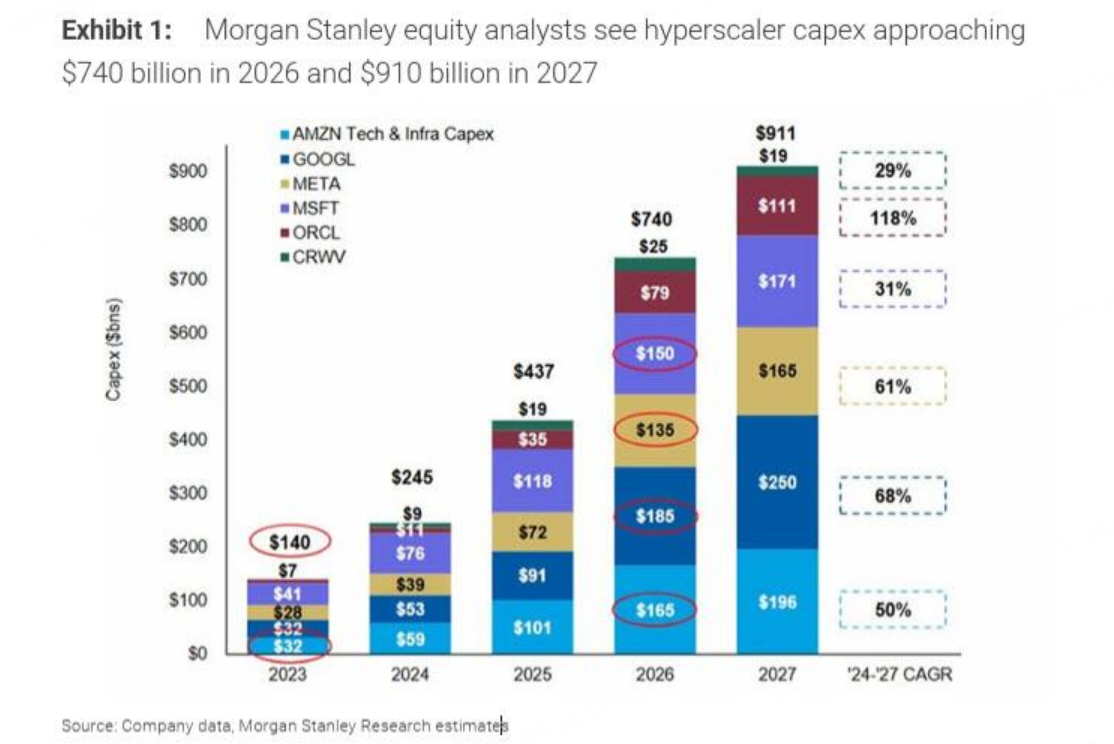
At first glance, the first argument does seem to make sense. Morgan Stanley currently expects large technology companies—these hyperscale computing providers—to continue increasing capital expenditure on computing capacity. Estimated capital expenditure for the whole of 2026 has already reached $740 billion, and in 2027 it will approach $1 trillion. The pace of that growth is still accelerating.
More Worrying: A Capital Loop Is Taking Shape
But if we think about it more carefully, two worrying issues emerge:
First, AI-related computing, semiconductors, and other large technology sectors have almost monopolized the entire rise in the S&P 500, while the equal-weighted S&P 500 is up by less than 6 percentage points:
Compared with the gains in the SOX, that rise is relatively insignificant. What does that tell us?
It tells us that the share prices of AI-related companies have already absorbed almost all of the market’s capital, making market concentration even stronger. Once the AI bubble bursts, it will almost certainly drag the broader market into a disorderly decline. At the same time, in the real economy, these AI-related companies have also absorbed most of society’s capital and have increasingly turned into a self-reinforcing valuation game.
Under this logic loop, valuation and financial analysis become increasingly complex, and it becomes much harder for us to determine what real demand and real supply in the economy actually look like.
Take OpenAI, for example, one of the AI application companies with a high market presence today. Last autumn, OpenAI said it wanted to carry out a series of data center infrastructure projects with a total investment of $1.5 trillion. That directly expanded the market’s imagination for the entire AI supply chain. But have you noticed what happens here? It invests in these companies while also giving them orders, and the returns generated by this computing infrastructure then flow back into its income statement through investment income. And this may be only one relatively simple example of the broader capital loop forming across the AI supply chain.
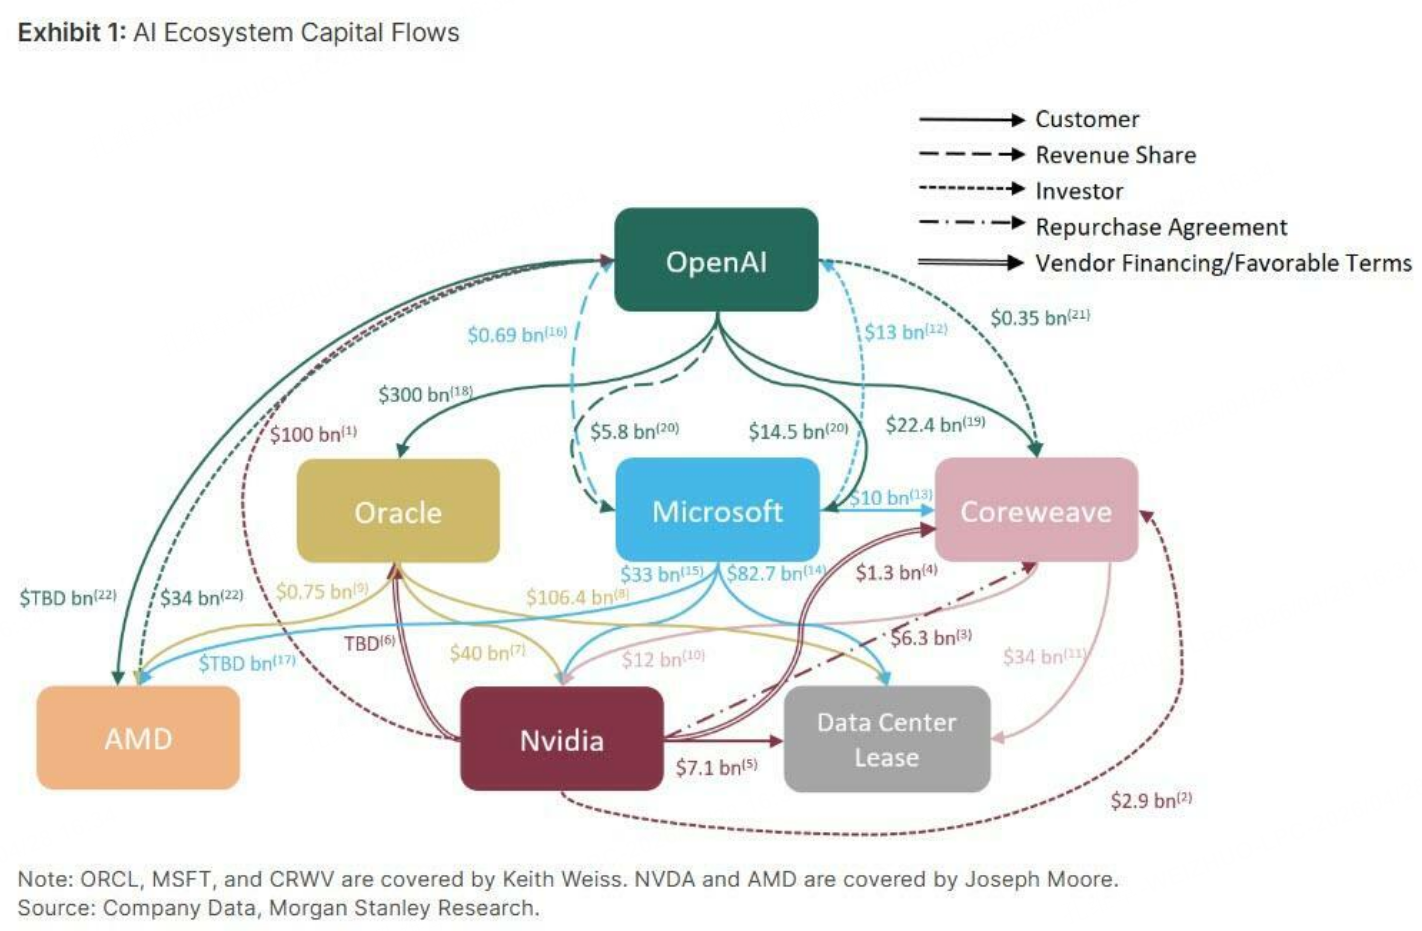
This kind of capital closed loop—“you pay me, I buy your chips, then you fund its R&D, and then it invests in your company”—has, to some extent, started to resemble a loosely linked pattern of circular capital flows across multiple companies.
The difference is that overseas markets are not regulated in exactly the same way as China when it comes to these kinds of linked capital arrangements, so this type of closed-loop capital flow has been able to grow larger and larger. The actual profit creation may not be that great, but it can significantly lift the valuations of all the related companies.
If you think about it carefully, even if parts of the U.S. AI supply chain have already developed a degree of circular capital linkage, who would dare expose the problem now, given the need to maintain the stability of the U.S. stock market and preserve the stock market as a stable source of capital for the real economy? The only likely outcome is that this type of transaction keeps growing larger.
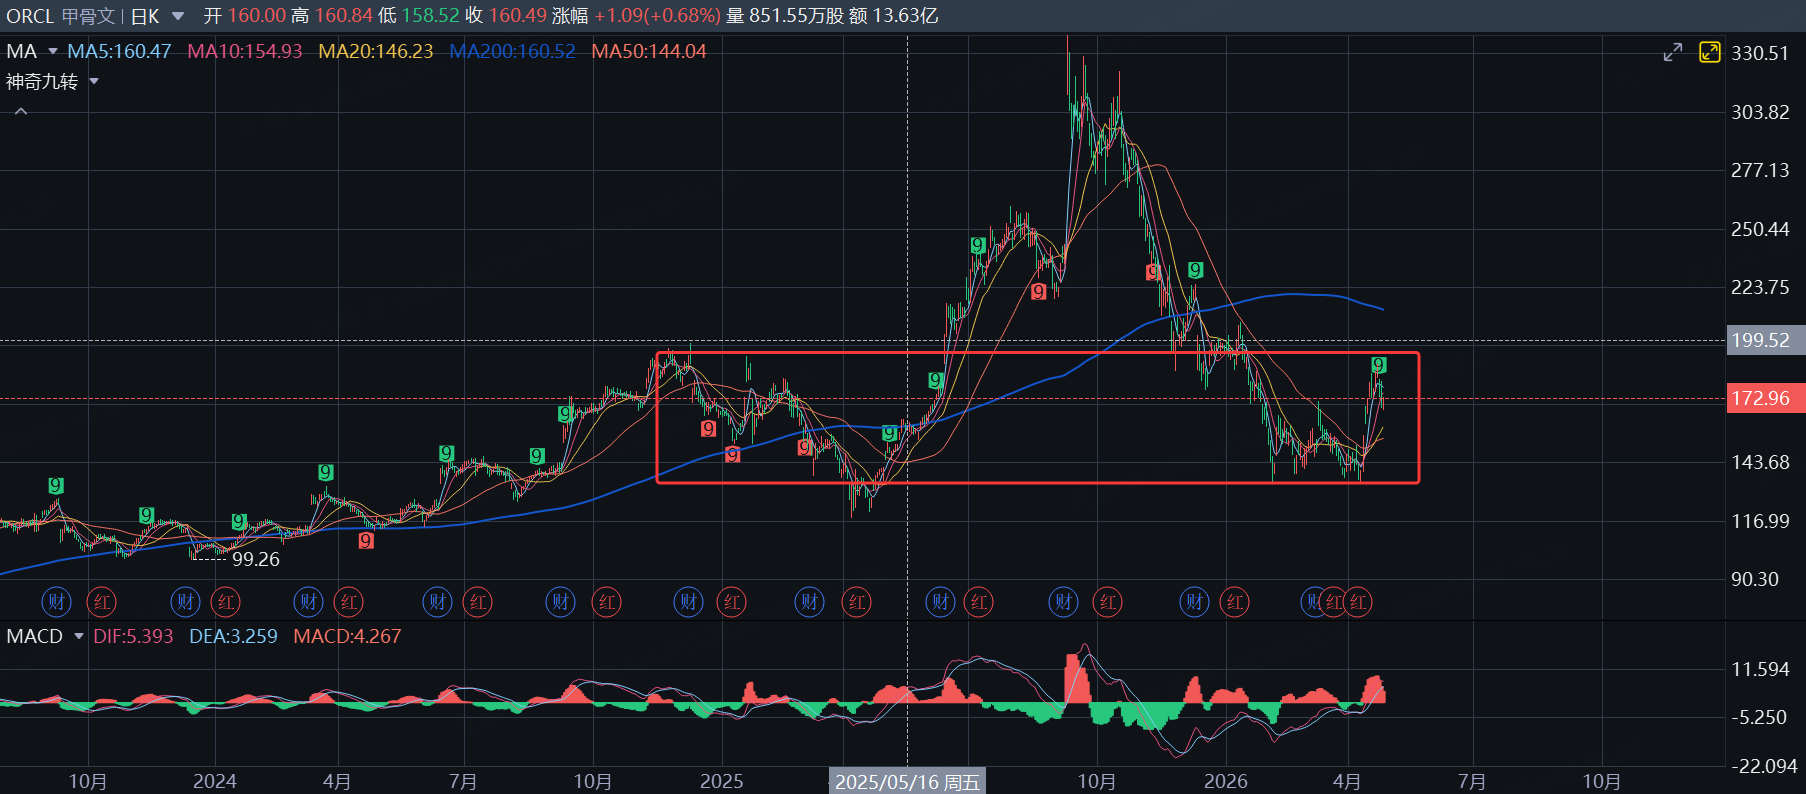
So if we want to test whether this game can continue in the future, what really matters is whether OpenAI's true operating profit—rather than its investment profit or non-operating profit—can turn positive. One simple way to gauge how the market is pricing this issue is to watch Oracle's stock. At present, Oracle's share price is still hovering at relatively low levels and continues to consolidate and build a base, with no clear sign of an upward breakout:
Relative Valuation May Not Look Crazy, but Absolute Valuation Is Still Rich
That is only one issue. Another concern I have is that even if the semiconductor sector’s relative valuation does not look extraordinarily expensive at the moment—an average valuation of 60 times is high, but not unbelievably high—things look different from the perspective of absolute valuation. The leading AI companies generally have very low dividend yields, which means their valuations still look extremely stretched in absolute terms. Looking at the latest dividend-yield data for some of these market favorites:
$英伟达(NVDA)$ $1.5倍做空NVDA ETF-Tradr(NVDS)$ $Mammoth Minerals Ltd(M79.AU)$ $高通(QCOM)$ $美光科技(MU)$ $美国超微公司(AMD)$ $英特尔(INTC)$
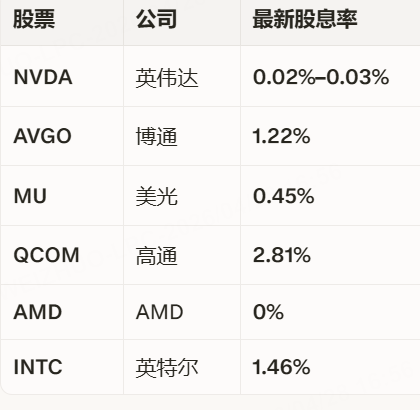
We can roughly estimate that the average dividend yield of the SOX semiconductor index is only around 0.35%, which is extremely low. If this situation does not improve, then once that self-reinforcing valuation game can no longer continue, the scale of the pullback could be quite large, because the degree of overvaluation in absolute terms is much greater than it appears in relative terms. Of course, from a political perspective, no one wants the AI bubble to burst. Almost everyone wants this story to continue, so perhaps there is no great need to worry too much about a major collapse caused by the bubble bursting.
Second: Geopolitics Is Driving More of This Rally Than It Seems
That is the valuation side of the story. Now let’s look at the geopolitical side. We can see that the market’s valuation of the SOX experienced an almost vertical surge at the beginning of 2026, and that was in fact directly related to the congestion in the Strait of Hormuz:
The congestion in the Strait of Hormuz directly pushed up the risk premium in the semiconductor sector through two channels:
First, in terms of raw material shortages: a blockage in the Strait of Hormuz would directly cut off supply routes for key raw materials, leading to shortages of helium, bromine, sulfur, aluminum, and copper. If demand does not weaken, the sharp increase in the cost of these raw materials will eventually be passed on to end-product prices.
Second, worsening shortages of electricity, natural gas, and other forms of energy could hinder the release of AI production capacity and increase expectations of delivery delays. So before the congestion causes even greater price increases, we may see expectations of a concentrated surge in orders for AI-related companies, which in turn pushes up the valuations of those companies.
That, too, is a risk factor. Once the market begins to expect a reopening or easing of the Hormuz crisis, could those valuation premiums fall back quickly and drag down AI stocks and the broader U.S. equity market in the short term? I believe that is entirely possible.
More Signs of Exhaustion
In fact, compared with the SOX semiconductor index, we should also note that GEV has risen even more sharply than the SOX.
$费城半导体指数(SOX)$ $GE Vernova Inc.(GEV)$
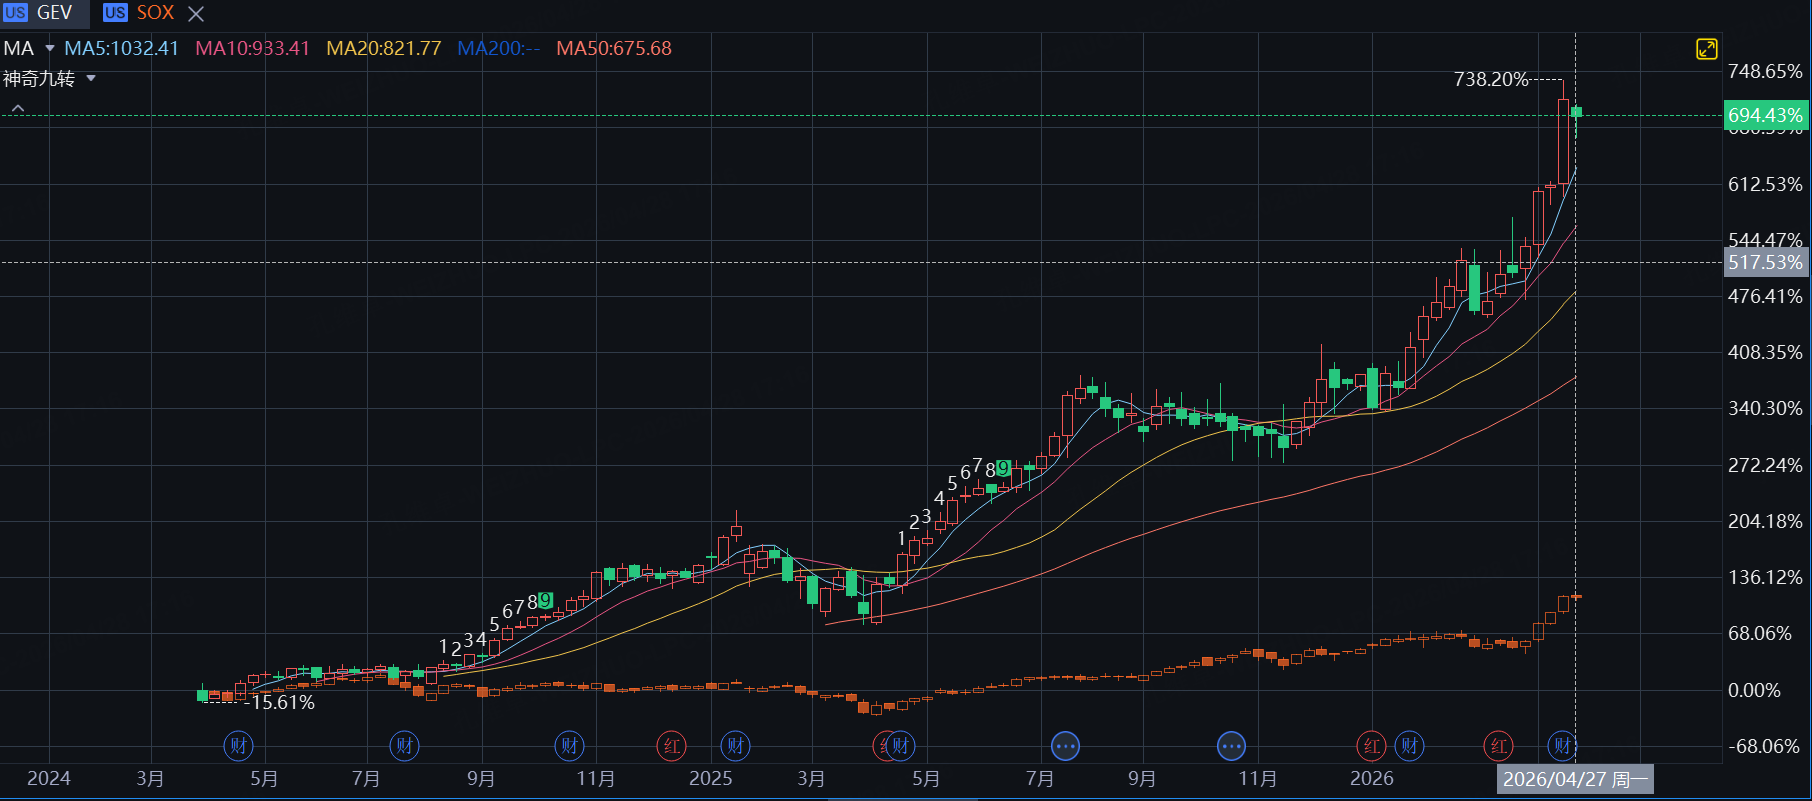
The SOX has risen more sharply than the S&P 500, and GEV has recently risen even more sharply than the SOX. This in fact reflects the market’s pricing of energy-shortage risks caused by the Strait congestion. If that crisis suddenly eases significantly, then in my view both the SOX and GEV could face a “buy the rumor, sell the fact” pullback in the short term.
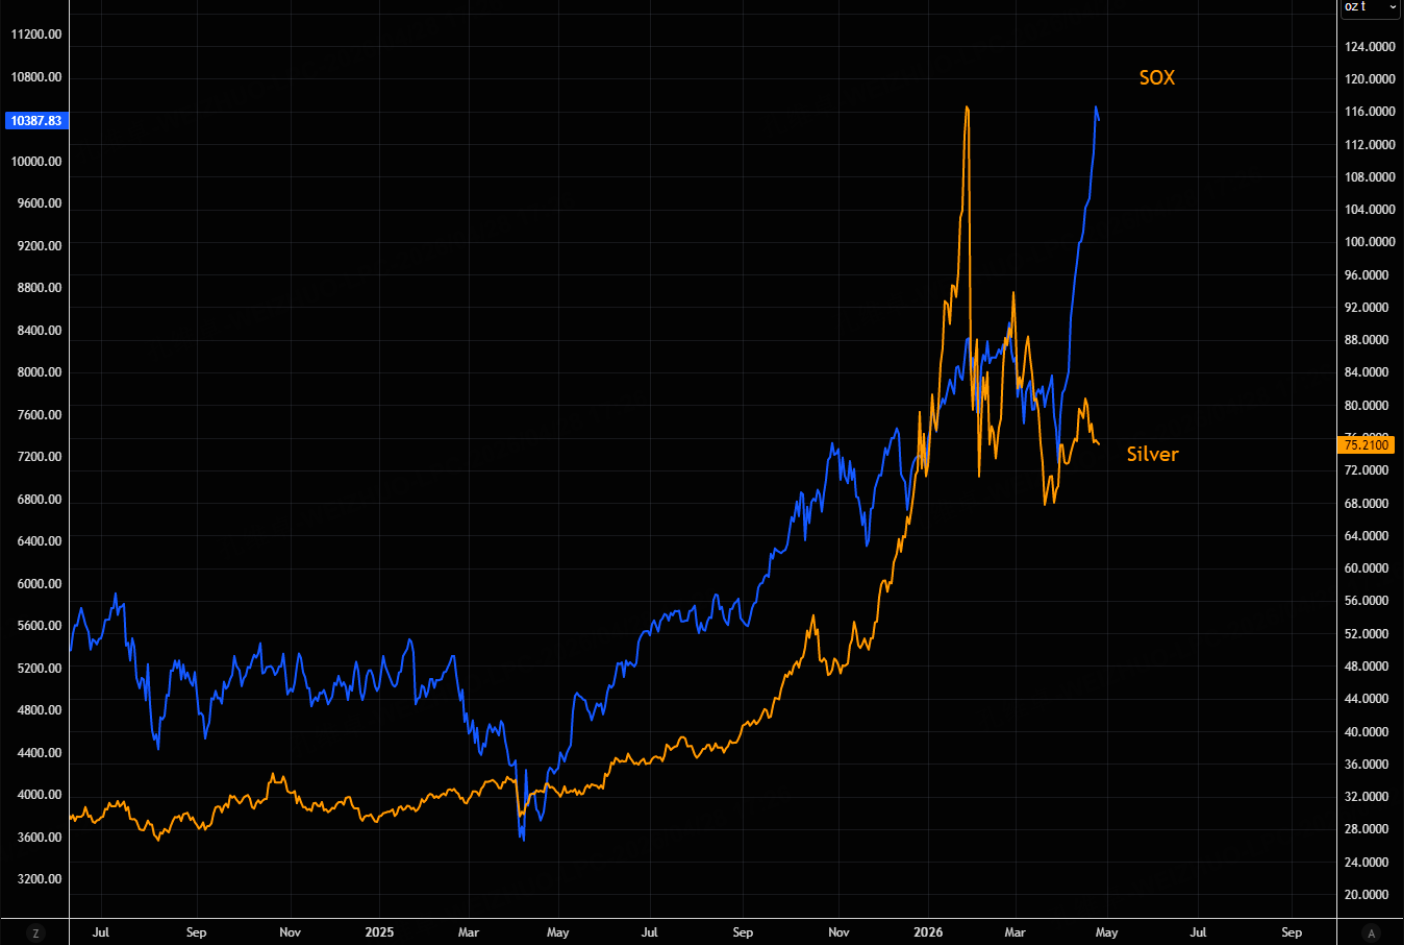
I believe the rise in semiconductor stocks has been more speculative in nature, and this is also directly reflected in the stability of futures prices for AI-related raw materials such as silver, copper, and aluminum. Although the SOX has risen sharply, these raw materials—which also face shortage expectations—have not risen along with it. From another angle, this also suggests that a large part of the recent rise in semiconductors may have been driven by speculation:
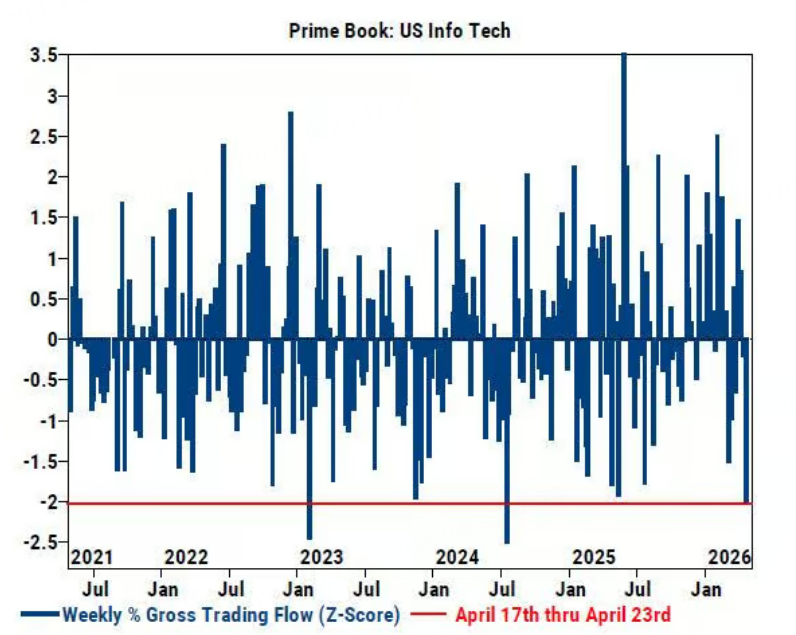
Now if we combine that with Goldman Sachs’ latest data, we see that in the most recent week, institutional net positioning in the technology sector fell sharply even as the Nasdaq moved higher:
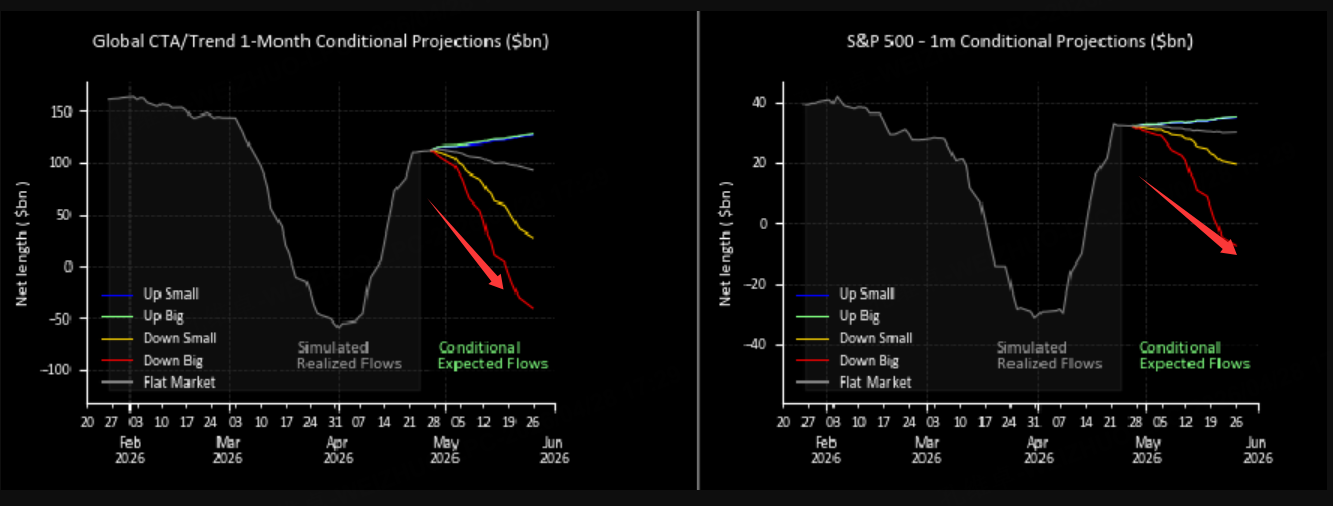
At the same time, the downside convexity of CTA-driven selling also increased clearly last week:
In addition, from a technical perspective, we can see that the S&P 500 has already shown a clear bearish MACD divergence at the top:
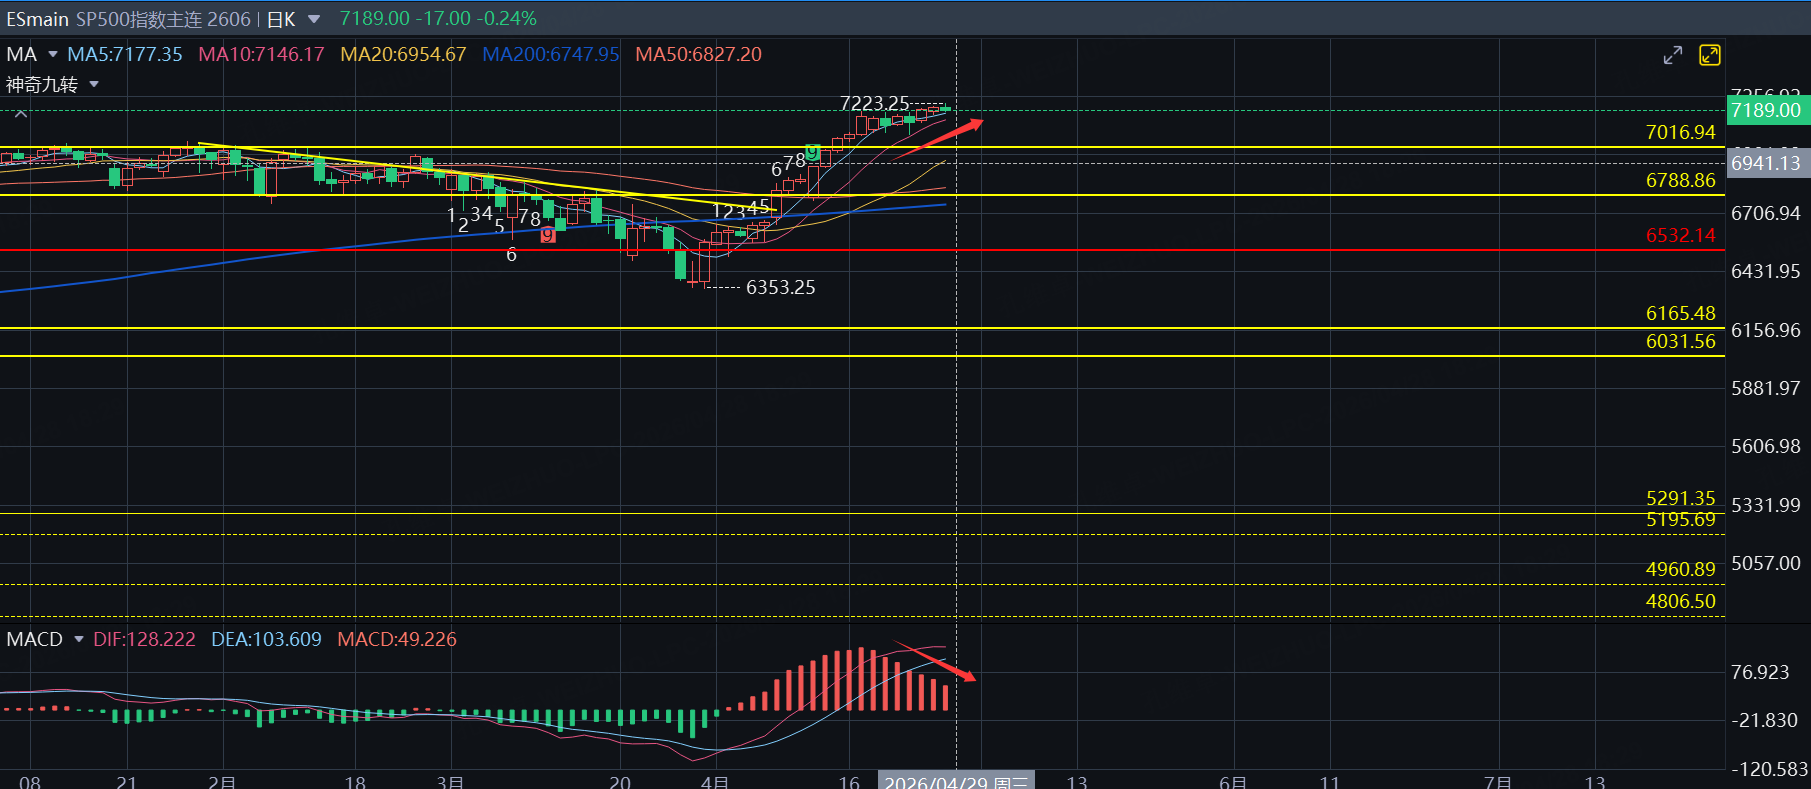
Taken together, these signals suggest that a pullback may be getting closer, even if it is not a large one.
Of course, over the longer term, we remain bullish on U.S. equities, because once the AI bubble has driven market gains to such a high degree of concentration and has had such a broad influence, I believe that no one, including President Trump, would want that bubble to burst in the short term. So the valuation transmission story I described above can probably continue for quite a long time.
So how large could this pullback be? For my estimate of the likely size of the move, you can refer to my previous article. Of course, in the middle of a primary uptrend, it is always very difficult to predict the exact timing and size of a correction with complete precision through technical analysis. The safer approach is still to avoid chasing at elevated levels and wait for a better entry point after a pullback, or wait for the S&P 500 to break out from a trading range and then reassess the market environment before turning bullish again.
$标普500(.SPX)$ $标普500ETF(SPY)$ $SP500指数主连 2606(ESmain)$ $微型SP500指数主连 2606(MESmain)$ $微型SP500指数2606(MES2606)$ $纳指100ETF(QQQ)$ $纳斯达克(.IXIC)$ $NQ100指数主连 2606(NQmain)$ $微型NQ100指数主连 2606(MNQmain)$ $道琼斯指数主连 2606(YMmain)$ $微型道琼斯指数主连 2606(MYMmain)$ $道琼斯(.DJI)$ $微型道琼斯指数2606(MYM2606)$ $道琼斯ETF(DIA)$
Comments