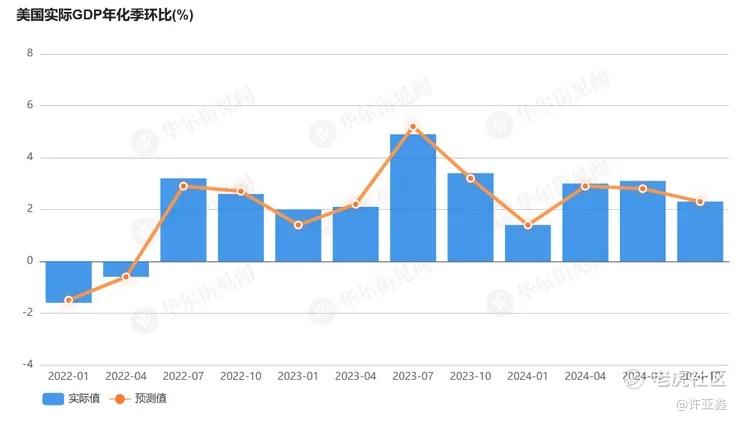
On Thursday, the U.S. Bureau of Economic Analysis released revised data for the fourth quarter, indicating that the annualized quarter-on-quarter growth rate of real GDP was 2.3%, unchanged from the initial estimate. While this represents a slowdown compared to previous quarters, it underscores the resilience of the U.S. economy.

Meanwhile, inflation data presents a less optimistic picture. The Federal Reserve's preferred inflation gauge, the core Personal Consumption Expenditures (PCE) price index—which excludes volatile food and energy prices—showed an annualized growth rate of 2.7% for the fourth quarter, revised upward from the previously reported 2.5%.

Durable Goods Orders Surge in January
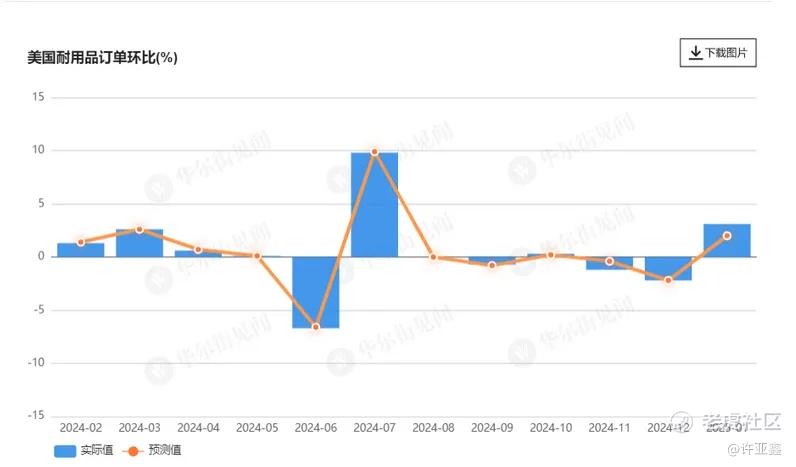
In addition, stronger-than-expected growth in the transportation sector propelled a sharp increase in U.S. durable goods orders for January, signaling a robust recovery in demand for durable goods. According to data released by the U.S. Department of Commerce, January's durable goods orders rose by a preliminary 3.1% month-over-month, exceeding the forecasted 2% and reversing December's decline of -2.2%.

Implications for Gold Prices
On one hand, the improvement in U.S. economic data and rising underlying inflation pressures present headwinds for gold prices. On the other hand, former President Trump reiterated his tariff policy stance, continuing to target Mexico and Canada, with new tariffs scheduled to take effect on March 4. This announcement spurred a rebound in the U.S. Dollar Index.
For those who missed the thematic lecture on January 23 and the public seminar on January 26, both of which extensively discussed the "spring rally" in gold, I had detailed the dynamics of this trend and issued warnings about potential pullbacks.
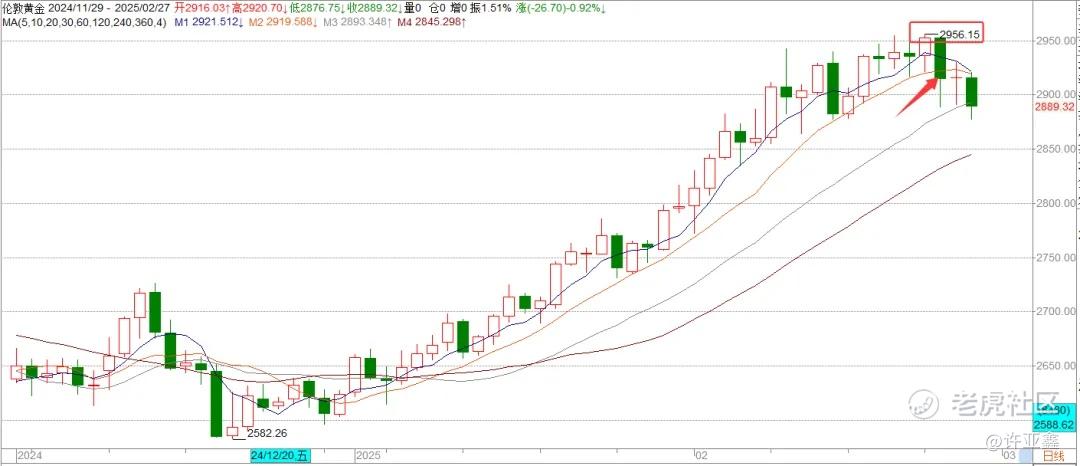
The spring rally, which began around Christmas Eve last year, reached its climax when gold hit a record high of $2,956 per ounce on February 24. However, this marked the end of the most definitive phase of the rally. In my previous commentary titled "0225: The Bright February Rally Nears Its End, Time to Reassess Full-Position Strategies," I clearly highlighted these developments and cautioned readers to prepare for the next phase.

Turning Point in Gold Prices
On Tuesday, gold prices closed with a significant $38 drop, forming a bearish candlestick that effectively breached the 10-day moving average (depicted as the gold line in the chart above). This breakdown signals a disruption in the short-term uptrend, transitioning the market from a unilateral upward rally to a consolidation phase. The $2,956 high may now serve as a critical resistance level within the future consolidation range.

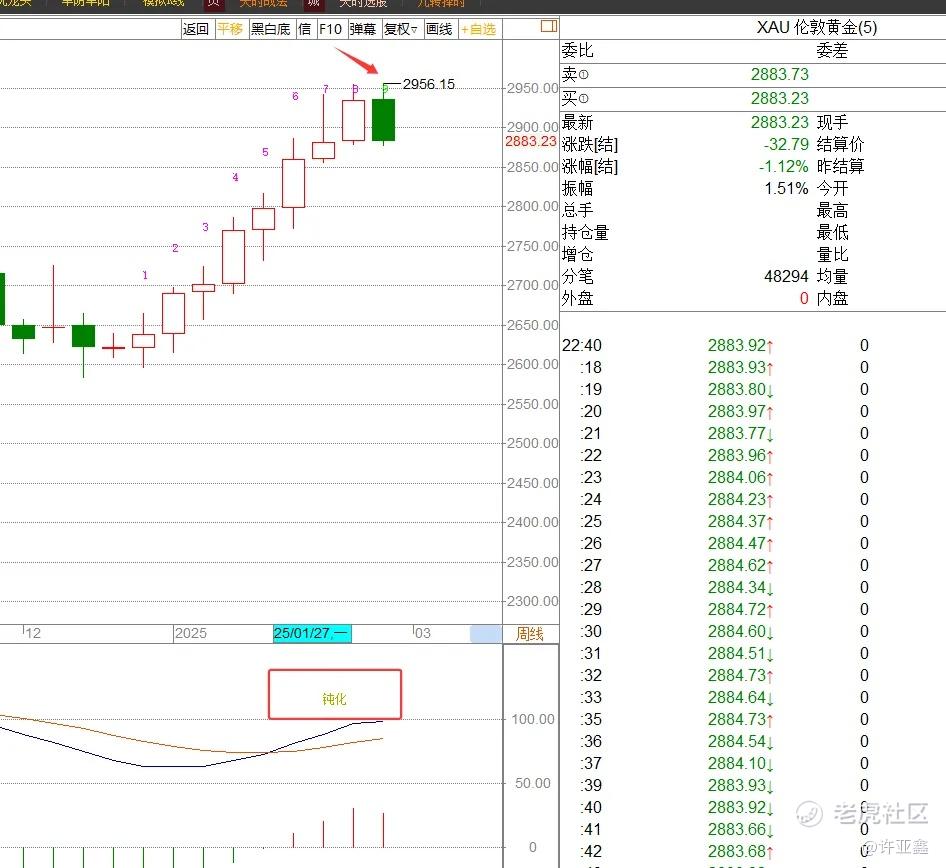
As shown in the weekly chart above, a "9+" TD Sequential exhaustion signal suggests that this week represents a pivotal turning point for gold prices. If a weekly top structure materializes, the market could face a corrective phase lasting one to two quarters.
$E-mini Nasdaq 100 - main 2503(NQmain)$ $E-mini S&P 500 - main 2503(ESmain)$ $Gold - main 2504(GCmain)$ $WTI Crude Oil - main 2504(CLmain)$ $Silver - main 2505(SImain)$
Comments