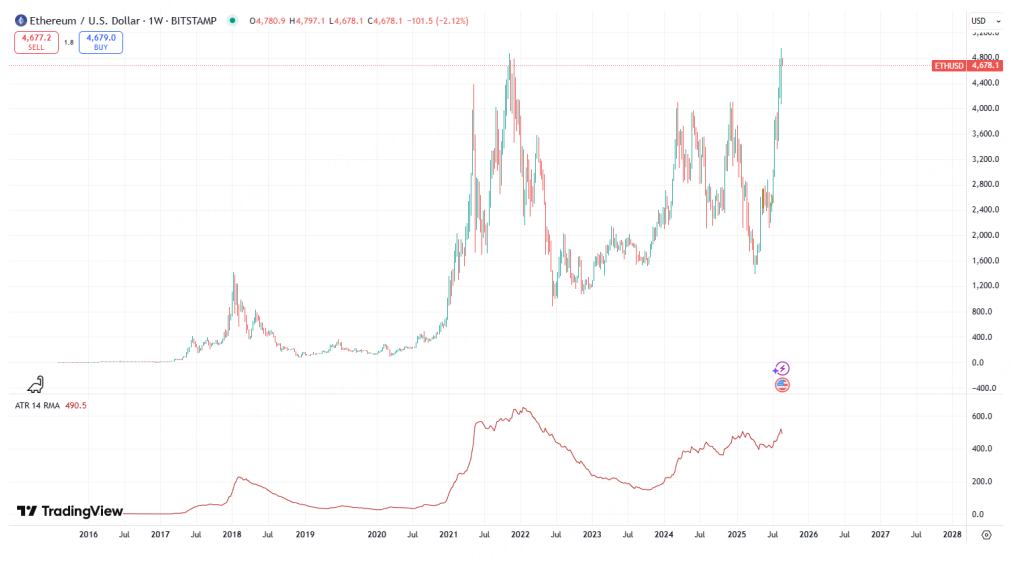
In early August, after Ethereum surged past 4000 with strong momentum, we predicted that bulls would inevitably need to push for a new high. Last week, following Powell’s comments hinting at rate cuts, ETH quickly rallied and ultimately surpassed the late 2021 peak. However, numerous indicators suggest this breakout and new high may not be solid, pointing to a risk of a bull trap.
The first signal we focus on is the Average True Range (ATR) volatility indicator. Unlike many assets, Ethereum’s price moves show a clear positive correlation with ATR, indicating ETH behaves more like a cyclical commodity than a pure risk asset like U.S. stocks. Around several notable peaks, volatility has been elevated. Yet, the current new highs—compared to those in 2021 and 2024—feature volatility levels at relatively low or neutral positions. This implies that the chasing momentum behind this rally is relatively weak.
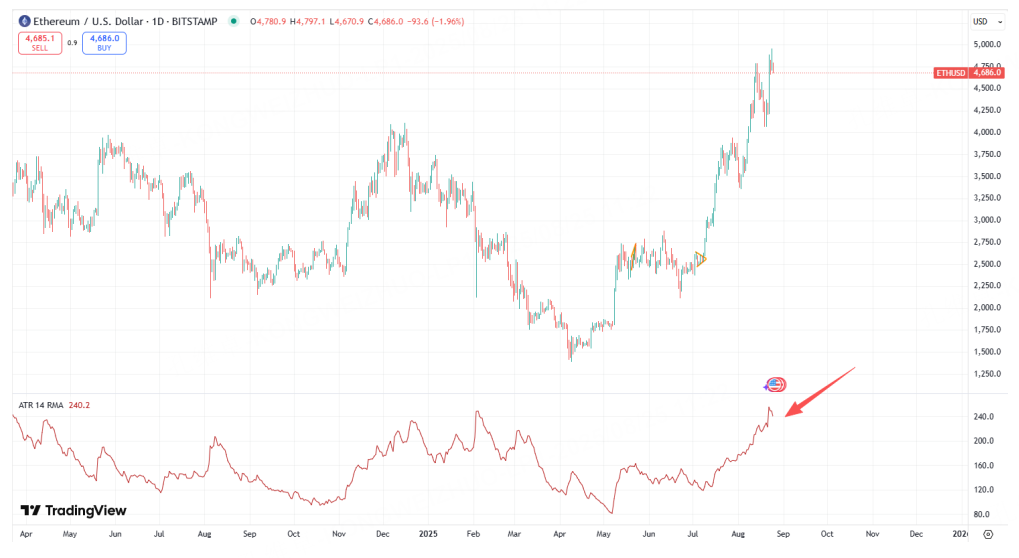
On daily volatility measures, the current readings are similar to those near the 4100 level, with no clear signs of further accumulation by bulls. Even more concerning is that after the price spike on Friday and reaching above 4900 on Sunday, volatility contracted further. Should volatility break its short-term support near 215, this would strongly confirm an imminent correction in price. This is why at the start of August we were bullish on seeing new highs but cautious about buying: while there is speculative energy, fundamentals do not support further strength.
Additionally, Bitcoin as a reference asset is not showing synchronized strength. Not only has BTC struggled to break its previous highs, but Friday’s bullish engulfing candle was quickly erased in subsequent trading, suggesting prior buy-the-dip momentum has already trapped many longs. Although recent months suggest BTC and ETH movements are not perfectly correlated, from a longer-term perspective such decoupling is rare. Eventually, the two should revert to their usual correlation.
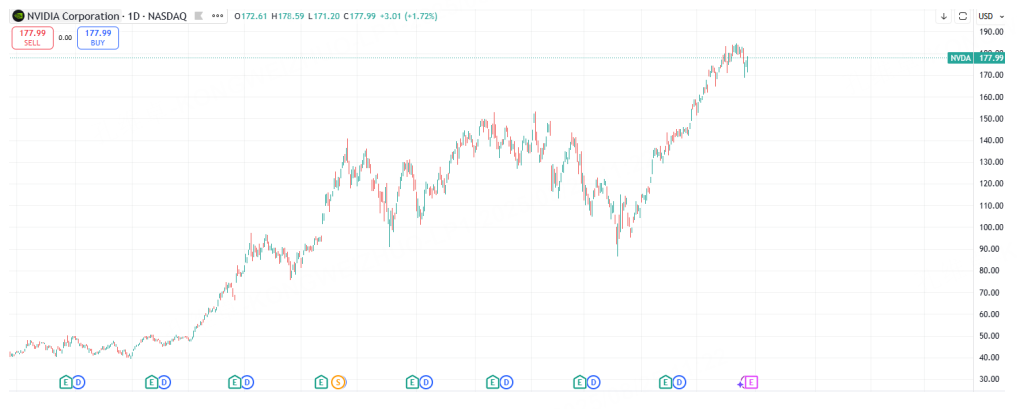
Thirdly, signals from the U.S. stock market and Nvidia provide a mixed picture. The S&P 500 has recently outperformed the Nasdaq, and Nvidia experienced a pullback mid-month, with this week’s price action being critical. Should these equities fail to support Ethereum’s strength, then once the rate cut expectations are fully priced in, the crypto market may face a terminal phase of exhaustion.
The artificial bull market driven by the tariff wars' aftermath under Trump’s administration is difficult to sustain, and another major crash during his tenure seems inevitable if mishandled. We might relive the frenzy similar to 2007/08. History doesn't exactly repeat, but there are no truly new phenomena under the sun. Caution might mean missing some profit opportunities and envying others’ gains; however, when the storm hits, one will realize that survival outweighs making big gains.
$E-mini Nasdaq 100 - main 2509(NQmain)$ $E-mini S&P 500 - main 2509(ESmain)$ $E-mini Dow Jones - main 2509(YMmain)$ $Gold - main 2512(GCmain)$ $WTI Crude Oil - main 2510(CLmain)$
Comments