1. weekly performance of major US stock index futures
In the past week, under the influence of the Federal Reserve's interest rate resolution and economic data, the market showed a trend of rising first and then declining. The futures of the three major stock indexes closed up, and the mini Nasdaq index was among the top gainers. The Fed raised interest rates by 25 basis points as expected by the market, which stimulated the optimistic expectation of the follow-up Fed to speed up the end of the interest rate hike cycle. However, the strong employment data dispelled the positive attitude of the market and deepened hawkish concerns, and US stocks were under pressure in the second half of the week. Specifically, from January 30 to 31, the market was mainly affected by the Fed's interest rate resolution meeting. After the Federal Reserve's interest rate resolution landed on February 1, market optimism warmed up, and the three major US stock indexes closed up collectively. With the data released on February 3rd showing that the unemployment rate in the United States recorded 3.4% in January, Lower than the previous value and expectation, the number of non-farm payrolls recorded 517,000, and the ISM non-manufacturing PMI recorded 55.2 in January. The employment and economic data performance in January far exceeded expectations, which eased the market's worries about the rapid economic recession, and at the same time strengthened the market's expectation of the Fed's firm hawkish operation. US stocks were under pressure and peaked and fell back.
Table 1: Current contract Zhou Du performance
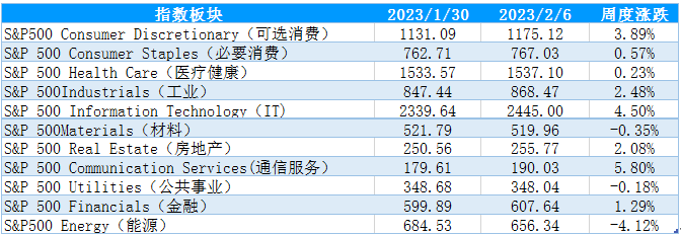
2. S&P 500 Industry Index Zhou Du Data
During the week from January 30th to February 6th, US time, The Fed's interest rate hike is in line with market expectations, market risk appetite has rebounded, and US stocks have rebounded in shock, but IT peaked and fell under the influence of employment data. Generally speaking, the S&P 500 index closed up last week, and the sectors rose more and fell less, among which only the materials, energy and public utilities sectors declined, while the rest sectors all went up, with communication services, IT and optional consumption sectors leading the increase.
Table 2: The weekly rise and fall of the S&P 500 industry index
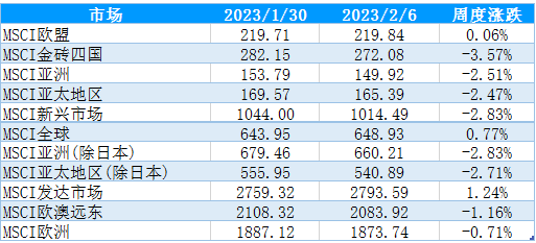
3. Zhou Du performance of MSCI core regional index
During the week from January 30th to February 6th, US time, The strong performance of U.S. employment data deepened market concerns about hawkish operations of the Federal Reserve. It pushed up the expectation that interest rates would remain high, reduced market risk appetite, and MSCI market index rose less and fell more, among which only MSCI EU, global and developed market indexes closed up, while other sector indexes all declined, with MSCI BRIC countries, Asia (except Japan) and Asia-Pacific region (except Japan) leading the decline.
Table 3: The rise and fall of MSCI core regional index in one week
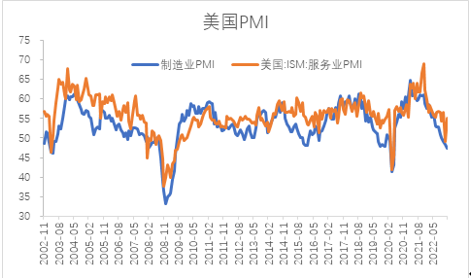
II. Fundamental Analysis (1) In January, ISM manufacturing PMI and service PMI in the United States showed differentiation, with weak supply and rebound in demand.
The data released on February 1 showed that the ISM manufacturing PMI in the United States recorded 47.4 in January, with a previous value of 48.4 and an expected 48; According to the data released on February 3rd, ISM non-manufacturing PMI in the United States recorded 55.2 in January, with the previous value of 49.2 and the expected value of 50.4. The manufacturing PMI in the United States continued to decline, while the non-manufacturing PMI rebounded and the index performance was divided. According to the breakdown data of ISM manufacturing PMI in the United States in January, the new order index and self-owned inventory fell by more than 2% month-on-month, indicating that both manufacturing demand and production willingness of enterprises declined, the price index went up month-on-month, and the order inventory improved month-on-month but still below threshold. The manufacturing PMI data showed that the production and supply in the United States were weak. The non-manufacturing PMI exceeded market expectations. In December last year, the non-manufacturing PMI dropped sharply due to the impact of snowstorm. As the weather weakened, the service activities returned to normal, which led to the rebound of PMI. At the same time, it also indicated that the demand for service industry in the United States remained relatively strong. Overall, while services are resilient, manufacturing PMI data show weak production and downward pressure on the economy.
Figure 1: ISM Manufacturing and Services PMI in January
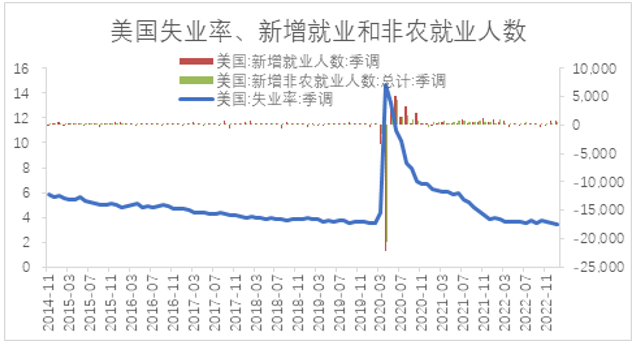
(2) The performance of non-farm payrolls, unemployment rate and the number of jobless claims in the United States in January exceeded market expectations, the job market performed strongly, and hawkish concerns warmed up.
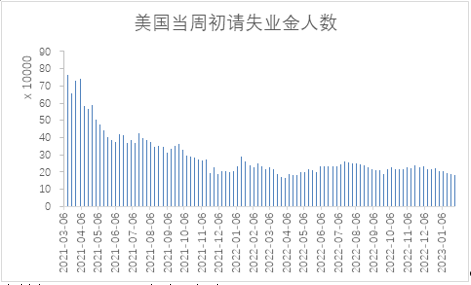
The data shows that the number of jobless claims in the United States from the beginning of the week to January 28 recorded 183,000, with a previous value of 186,000 and an expected 200,000; The unemployment rate in the United States recorded 3.4% in January, the previous value was 3.5%, and it is expected to be 3.6%; After the January quarter adjustment, the number of non-agricultural payrolls in the United States recorded 517,000, with a previous value of 260,000 and an expected 185,000. The employment data of the United States in January exceeded market expectations, and the employment performance of service industry was strong. On the one hand, employment data is a lagging indicator, and the response of interest rate hike and economic downturn to entities and employment lags behind. The impact of interest rate hike by the Federal Reserve has not yet fully appeared, especially in the service industry which is insensitive to interest rates. The service industry is the strong performance in January's non-agricultural data, and the impact of interest rate hike has not been fully reflected in these industries. Secondly, the service industry was greatly impacted by the epidemic and recovered late and for a long time, which supported the employment of the service industry to remain strong. On the other hand, when the labor supply is declining, considering the high cost of hiring and training new workers in the future, enterprises choose to retain existing employees in order to restore production capacity faster when the economy recovers. The strong employment has deepened the market expectation of hawkish operation of the Federal Reserve to a certain extent.
Figure 2: US employment data in January
Figure 3: Number of jobless claims at the beginning of the week
Since the end of 2022, important economic data such as retail sales, industrial output and real estate sales in the United States have obviously weakened, and the pressure of economic recession in the United States has been heating up. Although the demand for service industry remains elastic, the American economy faces downside risks. At the same time, in order to cope with the rising inflationary pressure, The Federal Reserve began to raise interest rates in March 2022 and raised interest rates six times in 2022. The target interest rate of the federal funds was raised to a high level of 4.75%, and the strong employment data made the high labor cost support inflation and restricted the space for subsequent monetary policy. Although the inflation level has declined at present, it is still at a medium-high level, and it is highly probable that the pressure of raising interest rates will last until May.
III. Position analysis
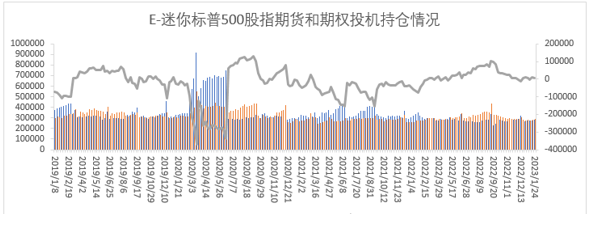
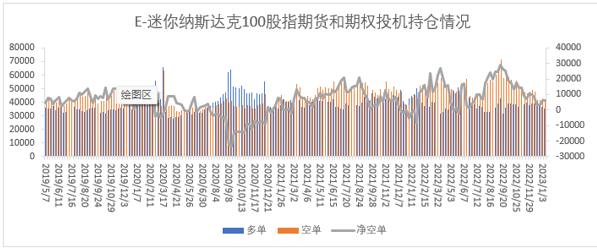
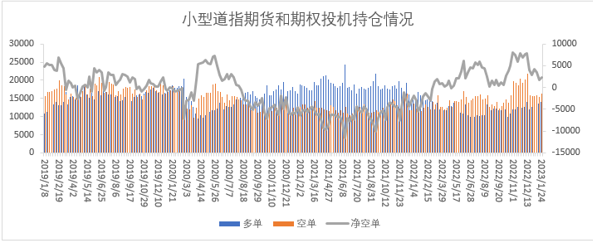
According to data released by the US Commodity Futures Trading Commission (CFTC), as of the week of January 24, the positions of speculative positions in E-mini S&P 500 stock index futures and options decreased from 9,708 lots to 4,439 lots, with multiple orders increasing by 10,889 lots and empty orders increasing by 5,620 lots; E-mini Nasdaq 100 index futures and options increased from 11,094 lots of clearance positions to 12,930 lots, 367 lots of multiple orders and 2,203 lots of empty orders; Dow Jones ($5) futures options clearance positions increased from 1,729 lots to 2,269 lots, multiple orders increased by 302 lots and empty orders increased by 842 lots.
From the perspective of positions, the speculative positions of small Dow futures, mini S&P 500 index futures and mini Nasdaq 100 futures increased by 1,144 lots, 16,509 lots and 2,570 lots respectively; From the change of headroom list, the headroom list of mini S&P 500 index futures decreased by 5,269 lots, the headroom list of mini Nasdaq 100 futures increased by 1,836 lots, and the headroom list of small Dow increased by 540 lots. Last week's position data showed that the clearance list of mini S&P 500 decreased, the position decreased, and the market short sentiment declined. This week, it was attacked by ransomware, and the CFTC trading report was delayed. According to the market performance in recent weeks, the bullish sentiment may cool down.
Figure 4: Changes in speculative positions of mini S&P 500 futures options
Figure 5: Changes in speculative positions of E-mini Nasdaq 100 futures options
Figure 6: Changes in speculative positions of Dow Jones ($5) futures options
$E-mini Nasdaq 100 - main 2303(NQmain)$ $E-mini Dow Jones - main 2303(YMmain)$ $E-mini S&P 500 - main 2303(ESmain)$ $Gold - main 2304(GCmain)$ $Light Crude Oil - main 2303(CLmain)$

Comments