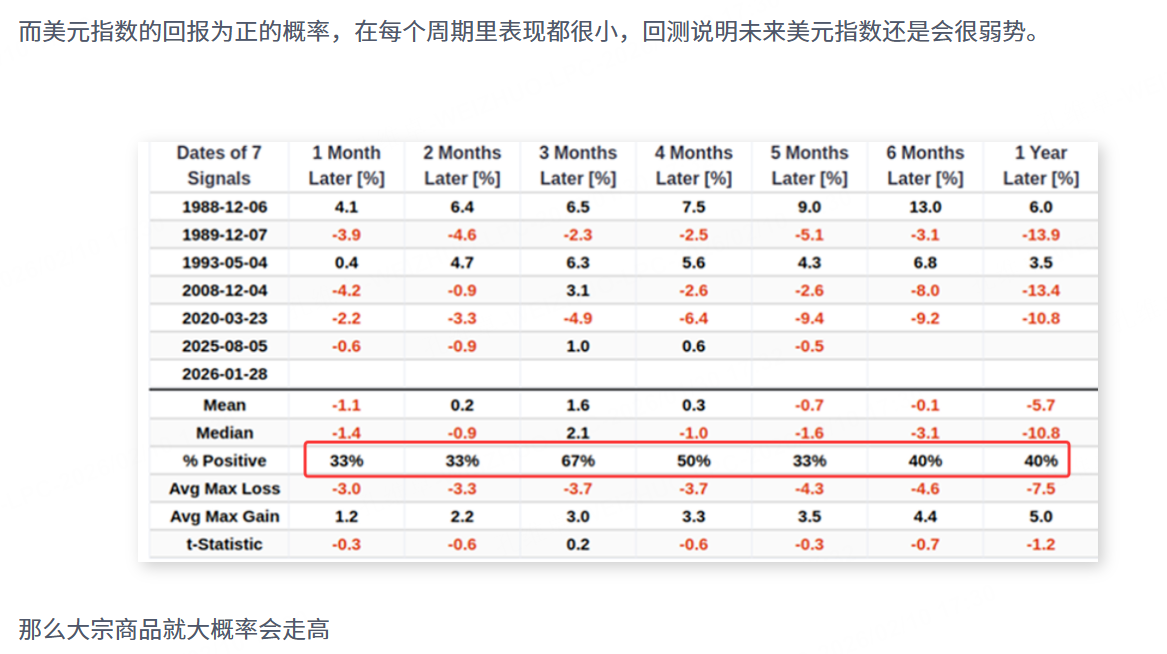
The market’s focus is gradually shifting from gold and silver to U.S. equities, but we want to remind everyone that around the coming Spring Festival period, U.S. equities are actually the asset most in need of bearish “protection.”
After a sharp sell-off, the U.S. stock market has recently seen a modest rebound, which is technically normal. However, I would not take this small rebound as evidence that Hong Kong stocks, A-shares, and U.S. equities have returned to a sustained upward trend. On the contrary, I prefer to interpret it this way: the volatility cycle in U.S. equities most likely has not finished, and this rebound looks more like a “covering” move within volatility rather than a signal that a trend has been confirmed.
First signal: the DXY
The first signal that U.S. equities may remain weak at elevated levels is the U.S. Dollar Index (DXY). We previously saw the DXY break through an important resistance level during its prior sharp rise, and after expectations that hawkish heavyweight “Wosh” would become Fed Chair were nearly priced in, the DXY—stimulated by hawkish expectations—staged a brief counter-move.
If the DXY were to retest the pre-breakout resistance and hold without breaking down, it could potentially move up toward the 100 level and put high-level pullback pressure on gold/silver and on Hong Kong/A-share markets. But what happened instead was that the DXY looked extremely weak overnight: after testing the 20-day moving average, it rolled over again and broke two support levels in a row.
$美元指数(USDindex.FOREX)$ $美元树公司(DLTR)$ $新兴市场美元债ETF-iShares(EMB)$ $做空美元指数-PowerShares(UDN)$ $美元ETF-PowerShares DB(UUP)$
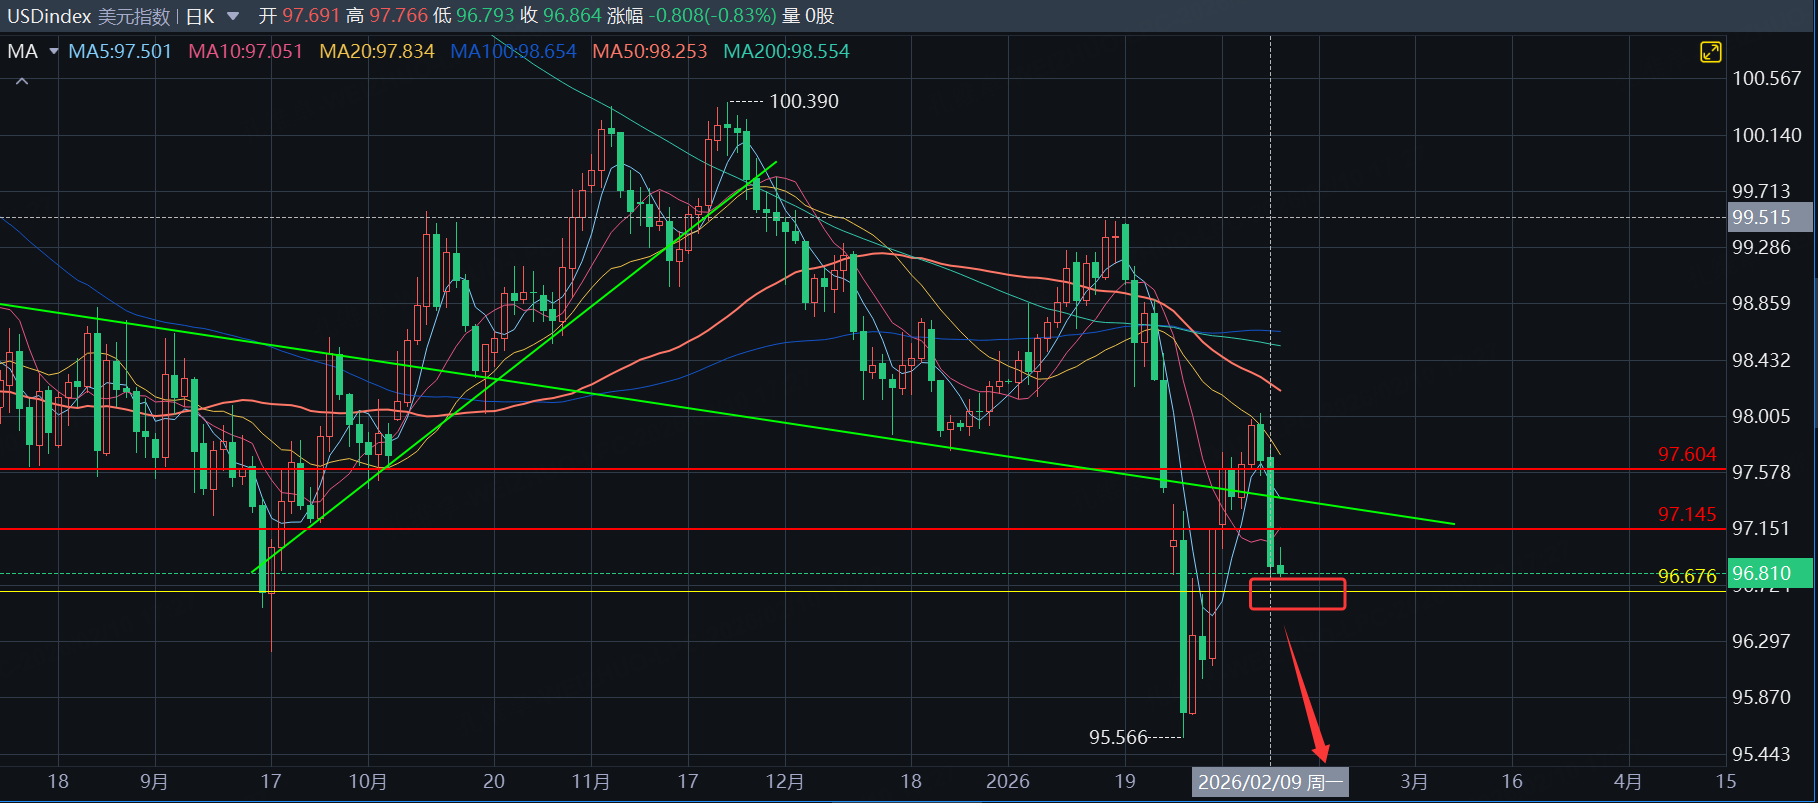
If the DXY cannot find support at its current level, it will inevitably retest the prior low around 95.5, and once that breaks, the downside could open up again. Recently, some overseas media have circulated claims that certain Chinese banks are considering further reductions in U.S. Treasury holdings; together with yen strength after Japan’s election outlook became clearer, these two factors have added pressure to the DXY and pulled it back down after its nascent rebound. This is consistent with the retest outcome we presented earlier
$日元主连 2603(JPYmain)$ $日元ETF-CurrencyShares(FXY)$ $日元ETF-ProShares两倍做空(YCS)$ $新兴市场小盘红利股ETF-WisdomTree(DGS)$ $三倍做多MSCI新兴市场ETF-Direxion(EDC)$

Review screenshot:
Fed Turns Hawkish—Risk Incoming? A Silver Bear Spread Setup—and Why I’m Waiting on Gold
As the importance of U.S. asset value is marginally declining, elevated U.S. equity levels will also be affected to some extent; and looking at U.S. equity volatility cycles, February is often a period when large swings occur, so we must be cautious about chasing rallies in U.S. equities here.
Second: technicals
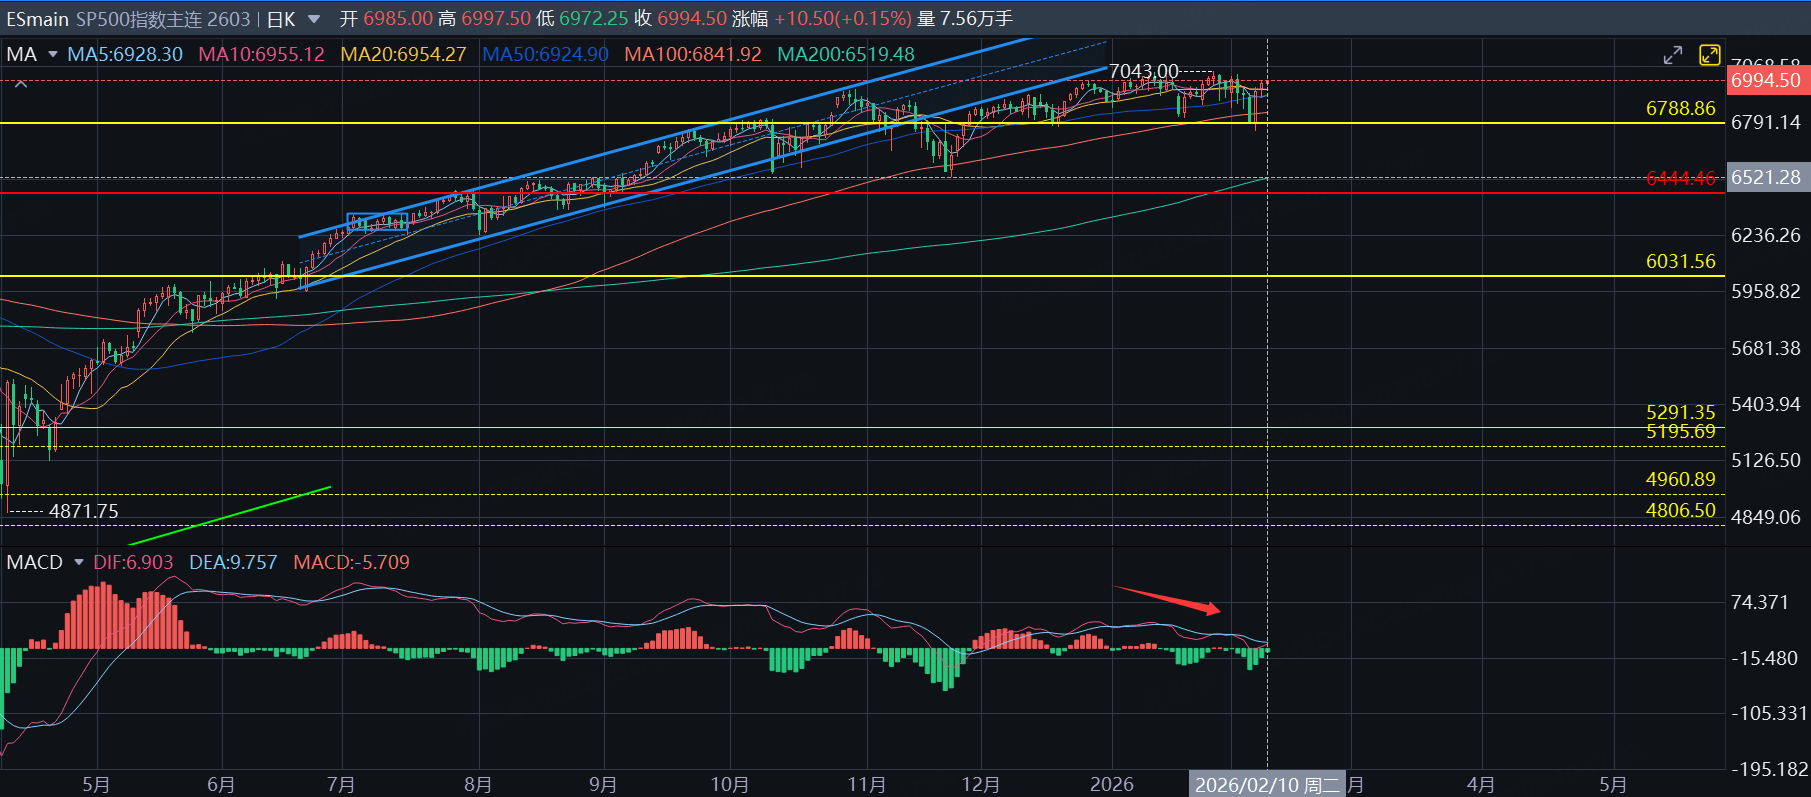
On the technical side, the S&P 500’s current path closely fits the pattern seen in the previous major pullback, and if a key resistance level—namely the S&P 500’s 20-week moving average—breaks down, the short-term pullback could be substantial.
$SP500指数主连 2603(ESmain)$ $微型SP500指数主连 2603(MESmain)$ $标普500波动率指数(VIX)$ $标普500ETF(SPY)$ $SP500指数主连 2603(ESmain)$
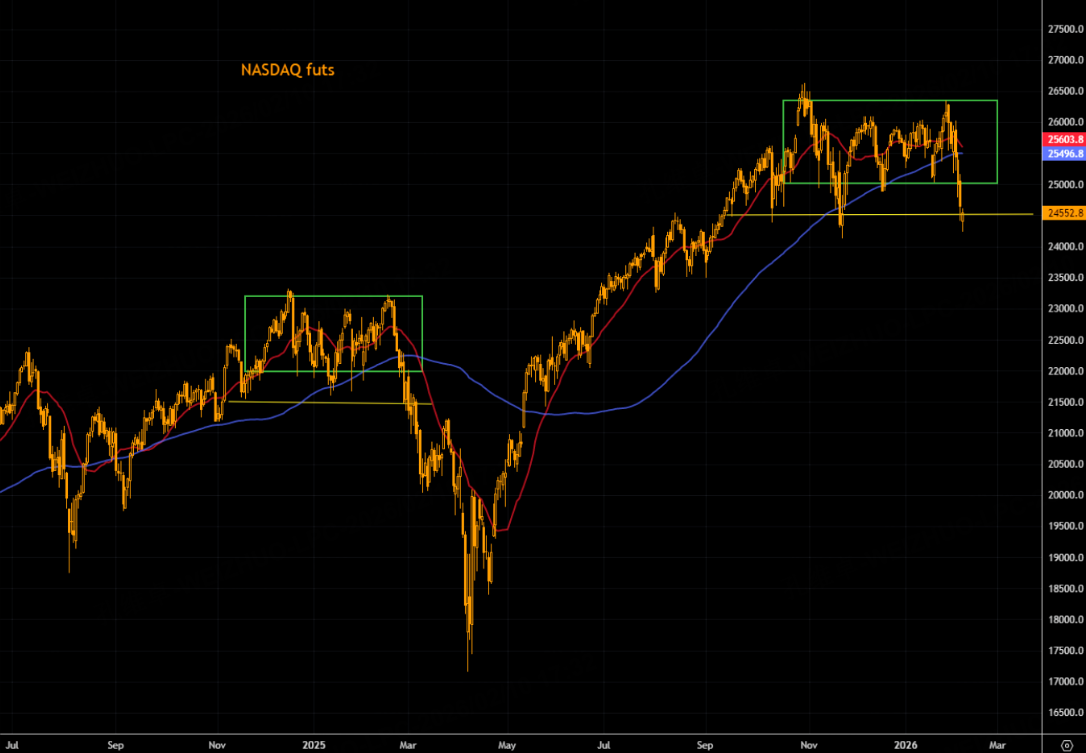
Moreover, if we shift the lens to the main continuous S&P 500 futures contract, price has already pierced the 20-week moving average, and within the daily structure, signs of a “bearish divergence breaking down” are becoming more obvious—given this picture, it is hard for me to bet that a clean, decisive uptrend has restarted.
$纳指100ETF(QQQ)$ $NQ100指数主连 2603(NQmain)$ $微型NQ100指数主连 2603(MNQmain)$ $微型NQ100指数2603(MNQ2603)$ $纳斯达克(.IXIC)$
So the current strategy is simple: if the S&P 500’s 20-week moving average (as well as the 6,788 yellow-line support level marked in the text) is lost, I will treat it as a signal that could trigger a much larger decline. Then, before the VIX has risen, we can first buy a put below the S&P 500’s 20-week moving average, with an expiry two weeks out, to provide protection—effectively buying insurance
Third: developments in liquidity conditions
The third clue comes from flows. From Goldman’s data, net inflows into the technology sector in the latest week are at a multi-year high, suggesting many traders are attempting to capture short-term rebound gains. But Goldman’s prime brokerage data show that last week, the notional short-selling volume in U.S. single stocks hit the highest level since 2016, reaching “3.2 standard deviations above the 5-year average.”
$道琼斯指数主连 2603(YMmain)$ $微型道琼斯指数主连 2603(MYMmain)$ $微型道琼斯指数2603(MYM2603)$ $道琼斯ETF(DIA)$ $房地产指数ETF-iShares道琼斯(IYR)$ $道琼斯指数主连 2603(YMmain)$
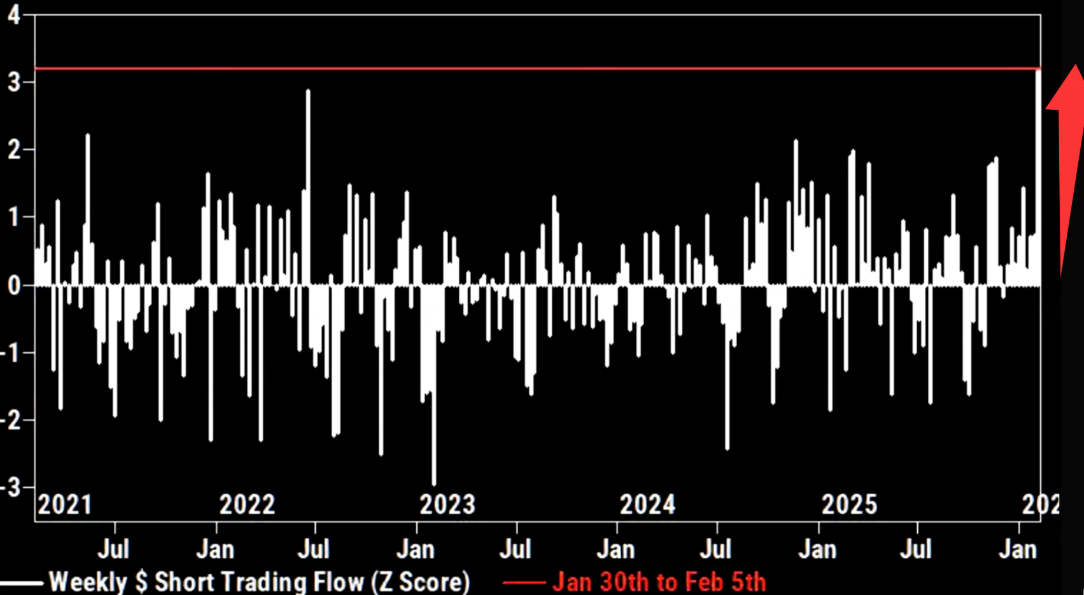
It is very clear: many people are buying the rebound while also putting on heavy bearish protection at higher levels. At the same time, I see in institutional positioning data that net short exposure has continued to accelerate upward since the start of 2026, and short positions are not only in individual stocks, but also placed in macro ETFs
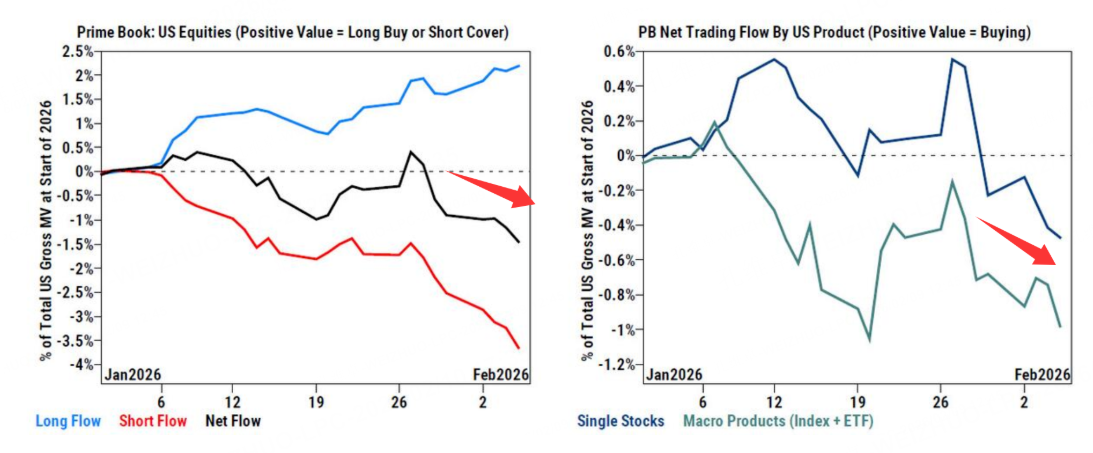
When “buying the rebound” and “thickening protection / accelerating shorting” appear simultaneously, it is easy to interpret these flows as follows: the trend may not have reversed, and risk is merely being temporarily masked by volatility.
Therefore, across the U.S., Hong Kong, and A-share markets, caution should dominate around the Spring Festival period, and among them U.S. equities deserve the most caution. I cannot rule out a sudden breakdown and decline in U.S. equities during the holiday period that triggers a global asset sell-off.
If we add a large position in the Hong Kong/A-share markets before the holiday, we may have to lock positions for a week over the Spring Festival, and in such a time window, if a crisis breaks out, the cost is often unbearable. On the longer cycle, I remain constructive on Hong Kong and A-shares; we still insist on buying on dips, while being cautious about chasing highs before the holiday. But for U.S. equities, I lean more bearish, and especially during China’s Lunar New Year period, I think there could be unexpected “trouble.”
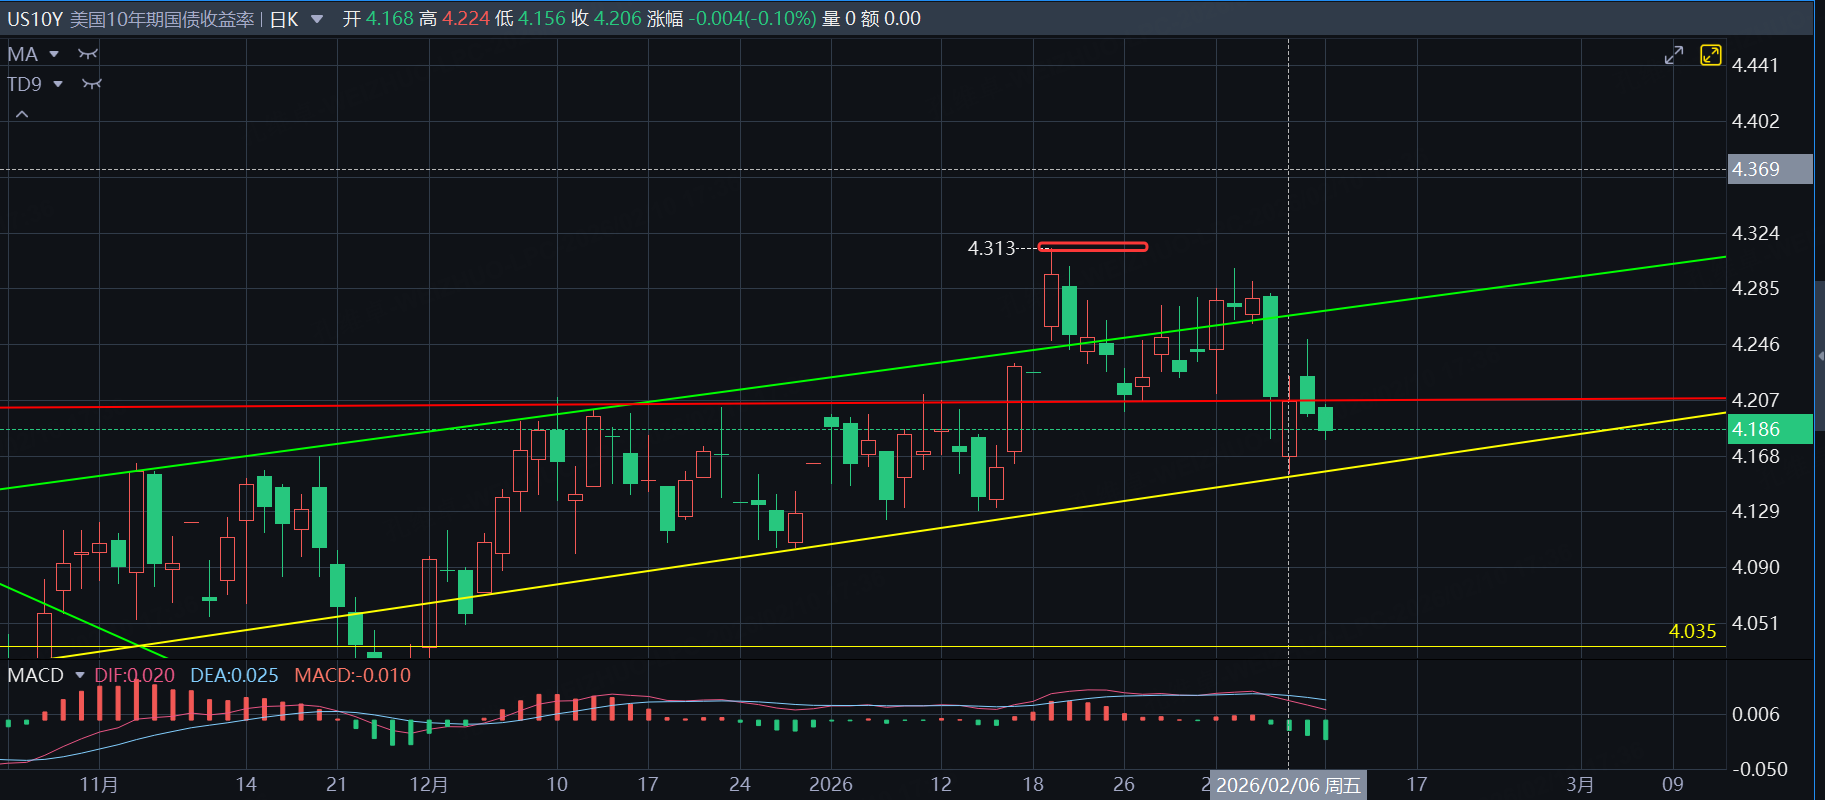
So if a “particularly strong” nonfarm payrolls print reduces rate-cut expectations, the possibility that the S&P continues to move lower cannot be ruled out. At present, the 10-year U.S. Treasury yield is at the key level of 4.2% and remains in an overall upward trend; if it breaks above 4.3%, it could put valuation pressure on high-level U.S. equities.
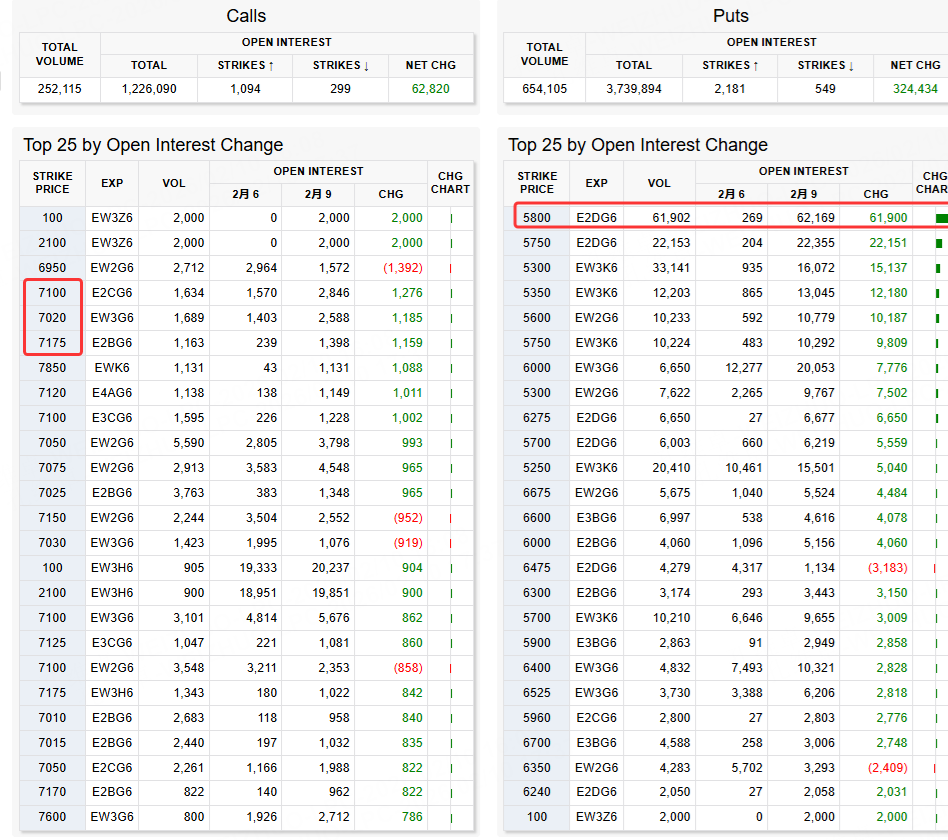
From the latest futures and options trading, we see a large amount of out-of-the-money call activity above 7,000, while large put bets are concentrated at 5,800.
Finally: gold and silver
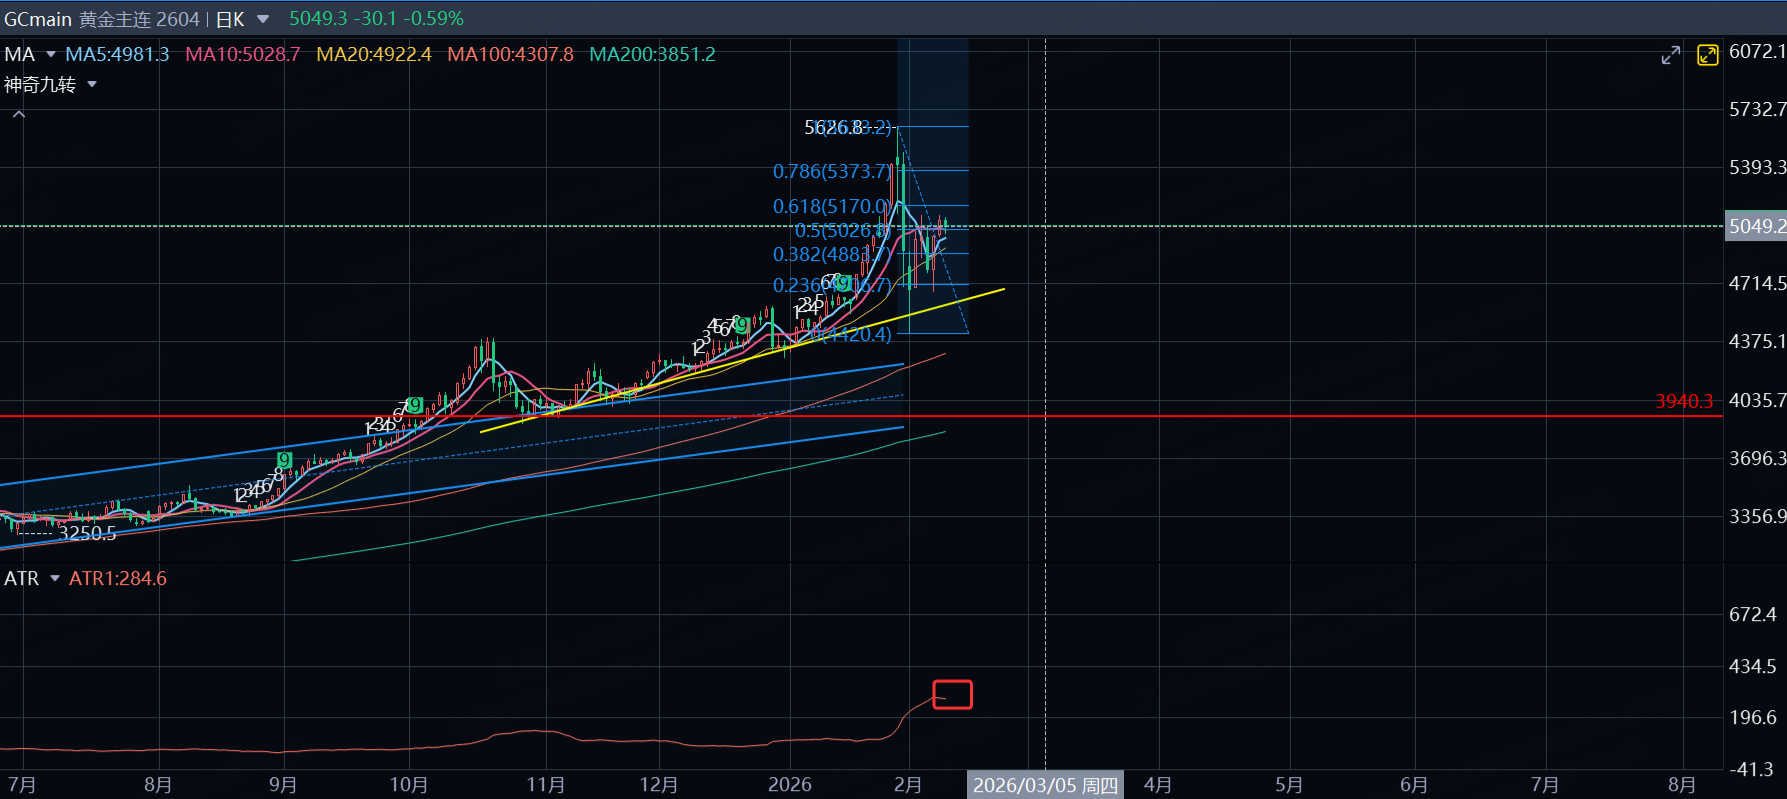
Finally, a word on gold and silver. We believe that after the prior washout, gold and silver are already at relatively low levels, and silver’s roughly 50% retracement from its highs also makes it look close to a low range. But we must emphasize that after a large decline, gold often chops around for a long time, and a consolidation cycle lasting as long as a month cannot be ruled out. Moreover, I see that gold and silver ATR remains elevated, which means short-term swings may still be large, and it is even possible that gold could see another leg of dumping from higher levels.
$黄金主连 2604(GCmain)$ $微黄金主连 2604(MGCmain)$ $1盎司黄金主连 2604(1OZmain)$ $迷你黄金主连 2604(QOmain)$ $美元黄金主连 2602(GDUmain)$ $黄金ETF-SPDR(GLD)$ $黄金矿业ETF-VanEck(GDX)$
Therefore, in gold and silver, I will not place a large bullish bet simply because they are “low.” Before a sufficiently solid base structure is formed, I would rather wait for the consolidation to end and then go long only after a right-side upward move appears. At the same time, I stick with that long-term view: from a five-year perspective, I believe the upside space for gold is immeasurable, even though short-term price fluctuations may still cause losses.
$白银主连 2603(SImain)$ $迷你白银主连 2603(QImain)$ $白银2603(SI2603)$ $2倍做多白银ETF-ProShares(AGQ)$ $白银ETF-iShares(SLV)$
Comments